- Basic Functions
- Mouse Actions
- Use Cases
- Frequently Asked Questions (FAQ)
- Troubleshooting
Linked pages:
By clicking the name, you will be directed to a new page.
1. Basic Functions ^
1. Pages ^
The ribbon at the top indicates all the pages that are included in the Infrakit software. Map is the default starting page when you log in to Infrakit software. By clicking the page icon below, you can find more information about each page.
By clicking the Infrakit logo on the left-top corner of the page, the user will be directed to the Infrakit starting page.
2. Add a New Task ^
By clicking the "+ Add new Task" button, a new box will open.

To create a new task, the user must insert a name for the task in the "Name" bar. This name will represent the task in Infrakit.
From the "Folder" drop-down bar, the user can select the folder where the task will be created.
The user can select from four different types of tasks: Model based mass calculation, Alignment based calculation, Grid based calculation, and Simple task.
By checking the "Create Schedule item automatically" box, the user can determine if a schedule item will be automatically created in the "Schedule" page. If the box is checked, in the "Start date (dd.mm.yyyy)" bar, the user can define the starting date for the task. In the "Duration (workdays) bar, the user can define the duration of the task, and based on this, the end date will be automatically calculated. In the "End date (dd.mm.yyyy)" bar, the user can define the end date for the task, and based on this date, the duration will be automatically calculated.
The user must click the "Create" button at the end to complete the creation.
Model-Based Mass Calculation ^
When the "Model based mass calculation" is selected and created, a new task module will appear in the selected folder.
By clicking the three dots at the end of the task module, two options will appear.
By clicking "Edit", the user can modify the name of the task and change the location folder.
By clicking "Delete", the user can delete the task.
By clicking the module, a new box will open.
In this box, the user can define certain attributes for the task.
From the "Alignment *" drop-down bar, the user can select the alignment that will be used in the mass calculation.
In the "Station start *" bar, the user can define the starting station for the mass calculation from the selected alignment.
In the "Station end *" bar, the user can define the end station for the mass calculation from the selected alignment.
In the "Station interval *" bar, the user can determine the interval used in mass calculation along the selected alignment. This determines the interval of the generated cross-sections.
From the "Calculation layer *" drop-down bar, the user can select the theoretical target surface for the excavation work.
From the "Reference layer *" drop-down bar, the user can select the measured current surface or starting state for the excavation work.
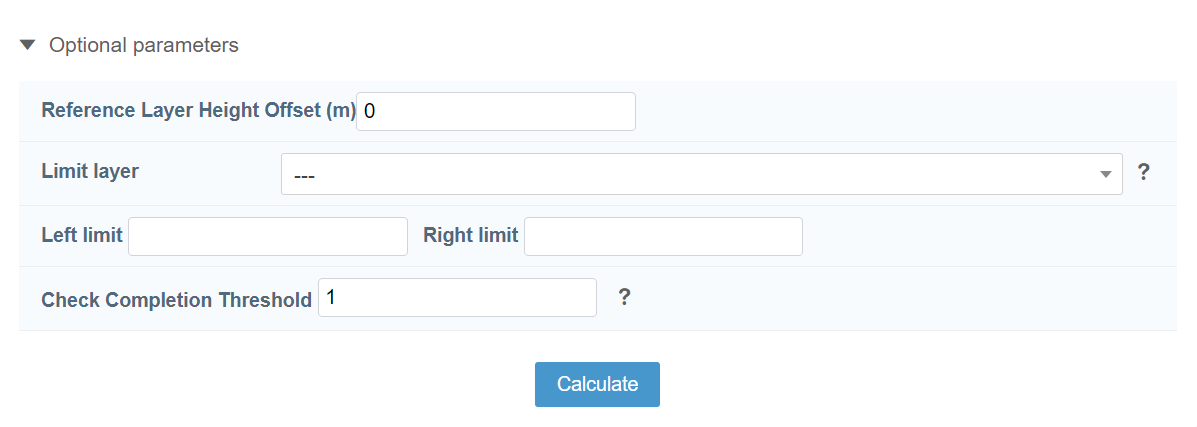
By clicking "Optional parameters", an additional box will open.
In this box, the user can provide additional attributes.
In the "Reference Layer Height Offset (m)" bar, the user can adjust the height offset of the selected reference layer.
From the "Limit layer" drop-down bar, the user can select a surface that represents the actualized excavation, which differs from the calculation layer that has been selected. For example, this can be used in a case where bed rock has been reached before the theoretical excavation depth.
In the "Left limit" bar, the user can define the distance that will be included in the calculations on the left side of the selected alignment. For example, -10 designates that 10 meters on the left side of the alignment will be included in the calculations. If the inserted value is positive, the distance is measured on the right side of the selected alignment.
In the "Right limit" bar, the user can define the distance that will be included in the calculations on the right side of the selected alignment. For example, 10 designates that 10 meters on the right side of the alignment will be included in the calculations. If the inserted value is negative, the distance is measured on the left side of the selected alignment.
In the "Check Completion Threshold" bar, the user can determine how many log points must be inserted in each interval to be marked as completed.
By hovering the cursor over the question mark symbol, additional information will be provided for each section.
By clicking the "Calculate" button, the user can start the mass calculation based on the provided information.
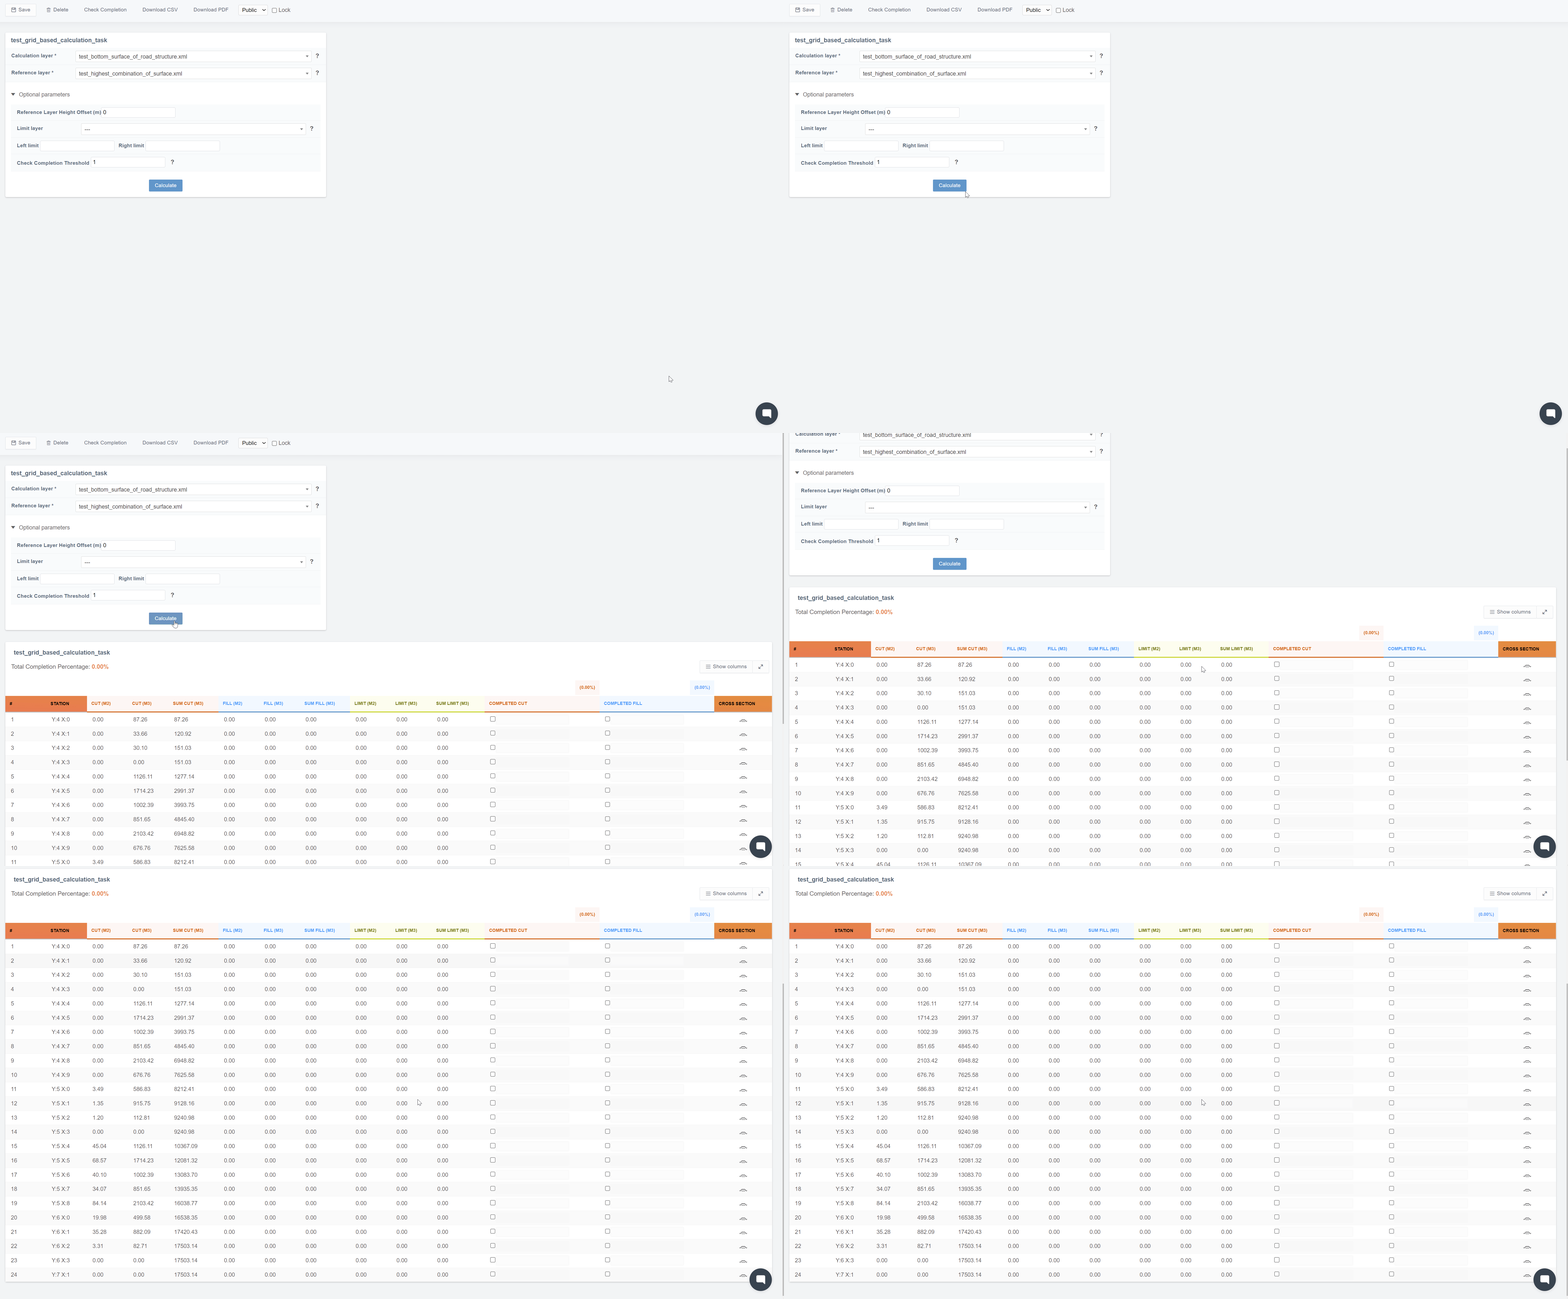
When the calculation is finished, a table will be generated under the box, which includes area and volume values. Each row in the table represents a station that has been generated based on the interval value inserted by the user.
By clicking the "Show columns" button, a new box will appear.

By checking and unchecking boxes next to an attribute, the user can determine which columns will be visible in the table.
By clicking the "Cut", "Fill", and "Limit" buttons at the bottom of the box, the user can check and uncheck all the columns at the same time that concern cutting, filling, or limiting.
By clicking the arrow icon button at the top right corner, the user can view the table in full screen.
By clicking the cross-section icon button at the end of each row, the cross-section window will open, which represents the cross-section at the specific station. The instructions for how to use cross-section view tools can be found on the "Map" page, section "Cross-Section Tools".
By checking rows under columns "COMPLETED CUT" and "COMPLETED FILL", the user can mark intervals as completed and provide the date of completion.
At the top of the page, a ribbon can be found with different features.
By clicking the "Save" button, the user can save all the modifications that have been made to the active task.
By clicking the "Delete" button, the user can delete the activated task.
By clicking the "Check Completion" button, the user can retrieve the latest measured log points and update the "COMPLETED CUT" and "COMPLETED FILL" columns in the table.
By clicking the "Download CSV" button, the user can download the table values as a CSV file.
By clicking the "Download PDF" button, the user can download the table as a PDF file.
From the "Private" drop-down bar, the user can choose if the task is private or public.
By checking the "Lock" box, the user can lock the table and prevent any modifications.
Alignment-Based Calculation ^
When the "Alignment based calculation" is selected and created, a new task module will appear in the selected folder.
By clicking the three dots at the end of the task module, two options will appear.
By clicking "Edit", the user can modify the name of the task and change the location folder.
By clicking "Delete", the user can delete the task.
By clicking the module, a new box will open.
In this box, the user can define certain attributes for the task.
From the "Alignment *" drop-down bar, the user can select the alignment that will be used in the calculation.
In the "Station start *" bar, the user can define the starting station for the calculation from the selected alignment.
In the "Station end *" bar, the user can define the end station for the calculation from the selected alignment.
By hovering the cursor over the question mark symbol, additional information will be provided for each section.
By clicking the "Calculate" button, the user can start the calculation based on the provided information.
When the calculation is finished, a table will be generated under the box. In this table, each row represents a station that has been generated based on the interval value inserted by the user.

By clicking the cross-section icon button at the end of each row, the cross-section window will open, which represents the cross-section at the specific station. The instructions for how to use cross-section view tools can be found on the "Map" page, section "Cross-Section Tools".
At the top of the page, a ribbon can be found with different features.
By clicking the "Save" button, the user can save all the modifications that have been made to the active task.
By clicking the "Delete" button, the user can delete the activated task.
By clicking the "Check Completion" button, the user can retrieve the latest measured log points and update the "COMPLETED" column in the table.
By clicking the "Download PDF" button, the user can download the table as a PDF file.
From the "Private" drop-down bar, the user can choose if the task is private or public.
By checking the "Lock" box, the user can lock the table and prevent any modifications.
Grid-Based Calculation ^
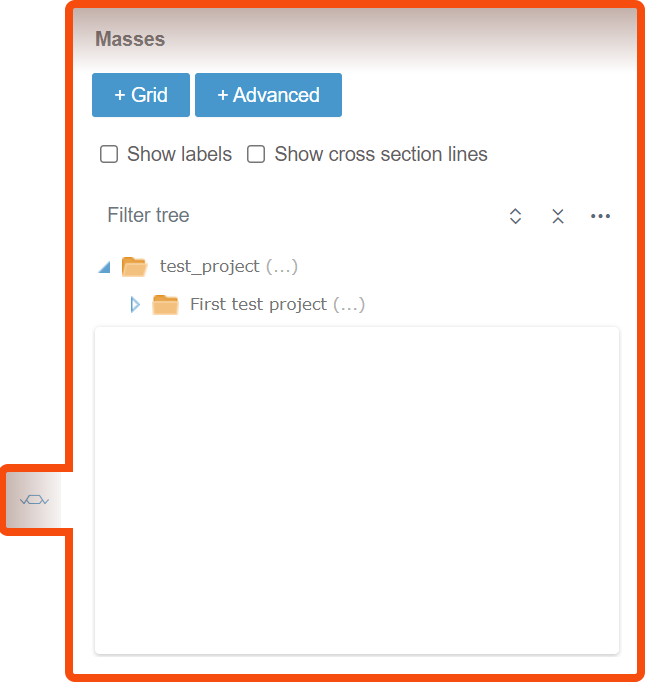
The "Grid based calculation" task must be created through the "Masses" tab in the "Map" page.
By clicking the "+ Grid" button, a new side window will open.
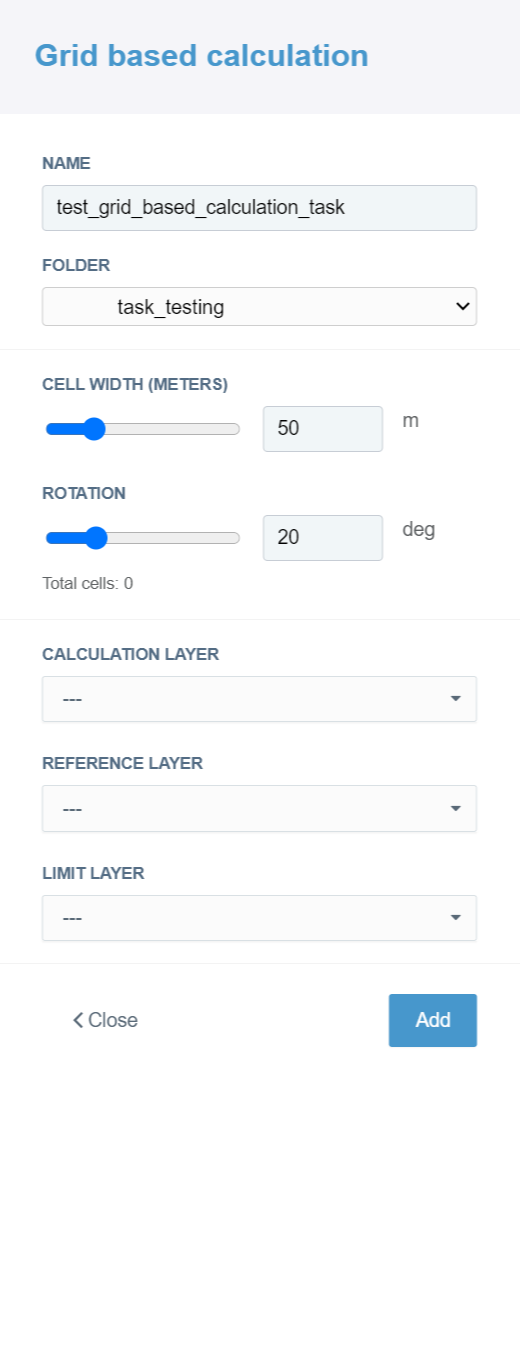
In this box, the user can create a new task.
To create a new task, the user must insert a name for the task in the "NAME" bar. This name will represent the task in Infrakit.
From the "FOLDER" drop-down bar, the user can select the folder where the task will be created.
In the "CELL WIDTH (METERS)" section, the user can define the width of an individual cell in the grid by sliding the knob in the slider or inserting a value in the bar.
In the "ROTATION" section, the user can define the rotation of an individual cell in the grid by sliding the knob in the slider or inserting a value in the bar.
From the "CALCULATION LAYER *" drop-down bar, the user can select the theoretical target surface for the excavation work.
From the "REFERENCE LAYER *" drop-down bar, the user can select the measured current surface or starting state for the excavation work.
From the "Limit layer" drop-down bar, the user can select a surface that represents the actualized excavation, which differs from the calculation layer that has been selected. For example, this can be used in a case where bed rock has been reached before the theoretical excavation depth.
By clicking the "Add" button, a new task will be created in the selected folder.
By clicking the "< Close" button, the side window will be closed without creating a task.
After the task has been created, the user can navigate to the "Masses" page.
The user can select the task module from the folder where the task has been created.
By clicking the three dots at the end of the task module, two options will appear.

By clicking "Export grid DXF", the user can export the grid as a DXF file.
By clicking "Delete", the user can delete the task.
By clicking the module, a new box will open.
In this box, the selected surface files can be observed in the sections "Calculation layer *" and "Reference layer *".
By clicking "Optional parameters", an additional box will open.
In this box, the user can provide additional attributes.
In the "Reference Layer Height Offset (m)" bar, the user can adjust the height offset of the selected reference layer.
From the "Limit layer" drop-down bar, the user can select a surface that represents the actualized excavation, which differs from the calculation layer that has been selected. For example, this can be used in a case where bed rock has been reached before the theoretical excavation depth.
In the "Left limit" bar, the user can define the distance that will be included in the calculations on the left side of the selected alignment. For example, -10 designates that 10 meters on the left side of the alignment will be included in the calculations. If the inserted value is positive, the distance is measured on the right side of the selected alignment.
In the "Right limit" bar, the user can define the distance that will be included in the calculations on the right side of the selected alignment. For example, 10 designates that 10 meters on the right side of the alignment will be included in the calculations. If the inserted value is negative, the distance is measured on the left side of the selected alignment.
In the "Check Completion Threshold" bar, the user can determine how many log points must be inserted in each interval to be marked as completed.
By hovering the cursor over the question mark symbol, additional information will be provided for each section.
By clicking the "Calculate" button, the user can start the mass calculation based on the provided information.
When the calculation is finished, a table will be generated under the box, which includes area and volume values. Each row in the table represents a cell in the grid.
By clicking the "Show columns" button, a new box will appear.

By clicking the "Cut", "Fill", and "Limit" buttons at the bottom of the box, the user can check and uncheck all the columns at the same time that concern cutting, filling, or limiting.
By clicking the arrow icon button, the user can view the table in full screen.
By clicking the cross-section icon button at the end of each row, the cross-section window will open, which represents the cross-section at the specific grid cell. The instructions for how to use cross-section view tools can be found on the "Map" page, section "Cross-Section Tools".
By checking rows under columns "COMPLETED CUT" and "COMPLETED FILL", the user can mark individual cells as completed and provide the date of completion.
At the top of the page, a ribbon can be found with different features.
By clicking the "Save" button, the user can save all the modifications that have been made to the active task.
By clicking the "Delete" button, the user can delete the activated task.
By clicking the "Check Completion" button, the user can retrieve the latest measured log points and update the "COMPLETED CUT" and "COMPLETED FILL" columns in the table. The "Total Completion Percentage" will also be updated.
By clicking the "Download CSV" button, the user can download the table values as a CSV file.
By clicking the "Download PDF" button, the user can download the table as a PDF file.
From the "Private" drop-down bar, the user can choose if the task is private or public.
By checking the "Lock" box, the user can lock the table and prevent any modifications.
Simple Task ^
When the "Simple task" is selected and created, a new task module will appear in the selected folder.
By clicking the three dots at the end of the task module, two options will appear.
By clicking "Edit", the user can modify the name of the task and change the location folder.
By clicking "Delete", the user can delete the task.
By clicking the module, a new box will open.

By clicking the plus icon button, the user can add rows to the table. In these rows, the user can determine the station, estimate, and complete values for the task. The sum will be calculated based on the values in the "ESTIMATE" and "COMPLETED" columns. "Total Completion Percentage:" will be calculated based on calculated "SUM" values.
At the top of the page, a ribbon can be found with different features.
By clicking the "Save" button, the user can save all the modifications that have been made to the active task. "SUM" value will be calculated after the "Save" button has been clicked.
By clicking the "Delete" button, the user can delete the activated task.
By clicking the "Download PDF" button, the user can download the table as a PDF file.
From the "Private" drop-down bar, the user can choose if the task is private or public.
By checking the "Lock" box, the user can lock the table and prevent any modifications.
3. Folder Tree Tools ^
Above the folder tree, different tools can be found to browse the folders.
In the "Filter tree" bar, the user can search folders from the folder tree.
By clicking the "Expand tree" button, the whole folder tree will be revealed.
By clicking the "Collapse tree" button, the folder tree will be collapsed so that only the root folder will be visible.
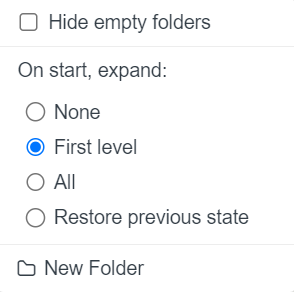
By clicking the "Tree settings" button, a box will appear.
By adding a check mark to "Hide empty folders" all the empty folders in the folder tree will be hidden.
"On start, expand", the user can determine how the folder tree is shown after the browser page has been reloaded, for example, when the user logs in to Infrakit or refreshes the page. "None" means that only the root folder is shown; "First level" means that only the direct subfolders of the root folder will be shown; "All" means that all the folders in the folder tree will be shown; and "Restore previous state" means that the previous state of the folder tree will be restored.
By clicking "New Folder", the user can create a new folder under the folder that has been chosen.
4. General Features ^
At the right corner of the top ribbon, four general features can be found.
By clicking the pen icon, the user will be directed to the "Project Editing" page.
From the drop-down box, the user can select the active project.
By clicking the bell icon, a new box appears.
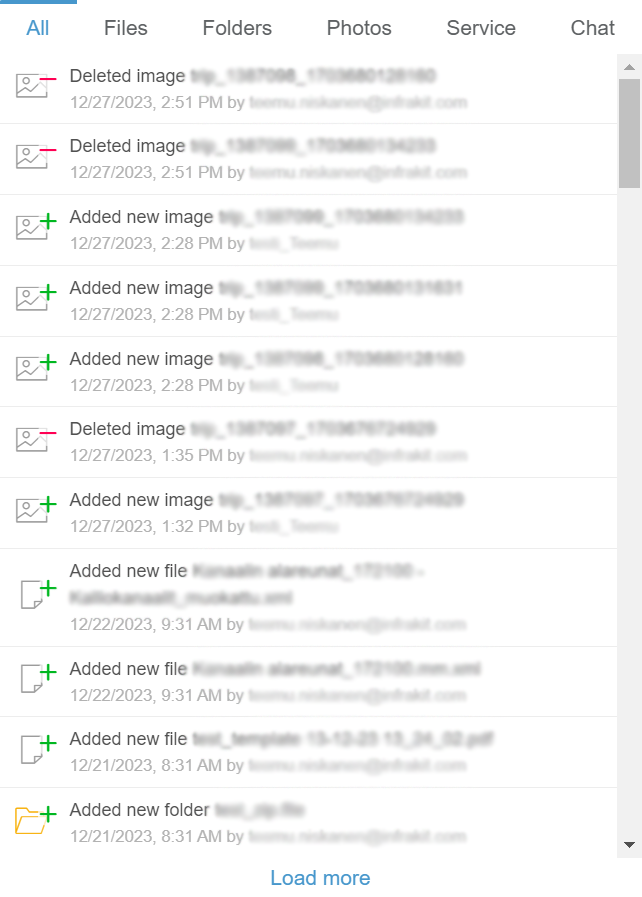
"All" is the default tab when the box opens. In this tab, all the notifications on the project are listed.
The "Files" tab contains all notifications concerning files.
The "Folders" tab contains all notifications concerning folders.
The "Photos" tab contains all notifications concerning image files.
The "Service" tab contains general notifications concerning Infrakit software.
Through the "Chat" tab, users can send messages inside a project.
By clicking "Load more", the user can observe older notifications.
By clicking the gear icon, a new box will open.
This box contains six options: "Project settings", "User settings", "Admin", "Invitations", "Support Center", and "Log out".
By clicking "Project settings", the user will be directed to the "Project Settings" page.
By clicking "User settings", the user will be directed to the "User Settings" page.
By clicking "Admin", the user will be directed to the starting page of the "Admin" features.
By clicking "Invitations", the user will be directed to a new page where invitations can be viewed and accepted or rejected.
By clicking "Support center", the user will be directed to the "Support Center" web page, where guidelines for how to use Infrakit software can be searched and contact information can be found.
By clicking "Log out", the user will be logged out of the Infrakit software.
5. Customer Support Features ^
By clicking the speech bubble icon, a new box appears.
Through the "Search for articles" bar, the user can browse Infrakit's knowledge base using key words that, for example, represent functions, tools, or operations.
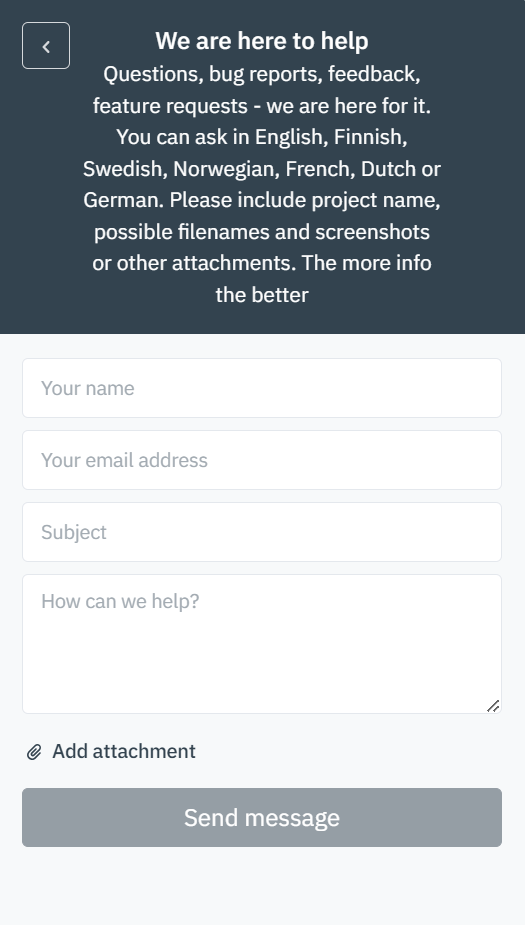
By clicking the "Create support ticket" button, a new view will appear.
In this view, the user can send a message to Infrakit's customer support team.
In the "Your name" bar, the user can insert his or her own name.
In the "Your email address" bar, the user can insert his or her own email address.
In the "Subject" bar, the user should write a succinct description of the issue.
In the "How can we help?" box, the user should describe the issue as detailed as possible. The more related information is provided, the easier it is for the support team to investigate the issue.
By clicking "Add attachment", the user can add attachments to the message. Attaching images, videos, and files where the issue occurs will help to solve the issue more efficiently.
By clicking the "Send message" button, the message will be sent to the support team.
By clicking the arrow icon button, the user can change to the previous view.
By clicking the x icon button, the user can close the customer support box.
2. Mouse Actions ^
By clicking a folder in the folder tree with the right button on the mouse, one option appears.
By clicking "New Folder", a box will open.
In this box, the user can create a new subfolder inside the selected folder.
In the "NAME" bar, the user must insert a name for the folder.
In the "DESCRIPTION" box, the user can provide additional information about the folder.
From the "PARENT FOLDER" drop-down bar, the user can change the parent folder for the new folder.
The user must click the "Create" button at the end to complete the creation. If the user wants to close the box without creating a folder, the "Close" button can be clicked.
3. Use Cases ^
