
Navigation
In this chapter, basic controls are explained that are used to navigate the application
Controls on the map screen:
Scroll with one finger: Pan the map
Tap with one finger: Select a button or material from the screen
Double tap with one finger and hold, then move finger up or down: Zoom map in or out
Pinch or expand with two fingers: Zoom map in or out
Rotate with two fingers: Rotate the map
Move two fingers up or down: Rotate the map vertically
Tap with one finger and hold on top of model: Open model info
Tap with one finger and hold on top of map: Open "Activate nearby models" menu
Main screen buttons:
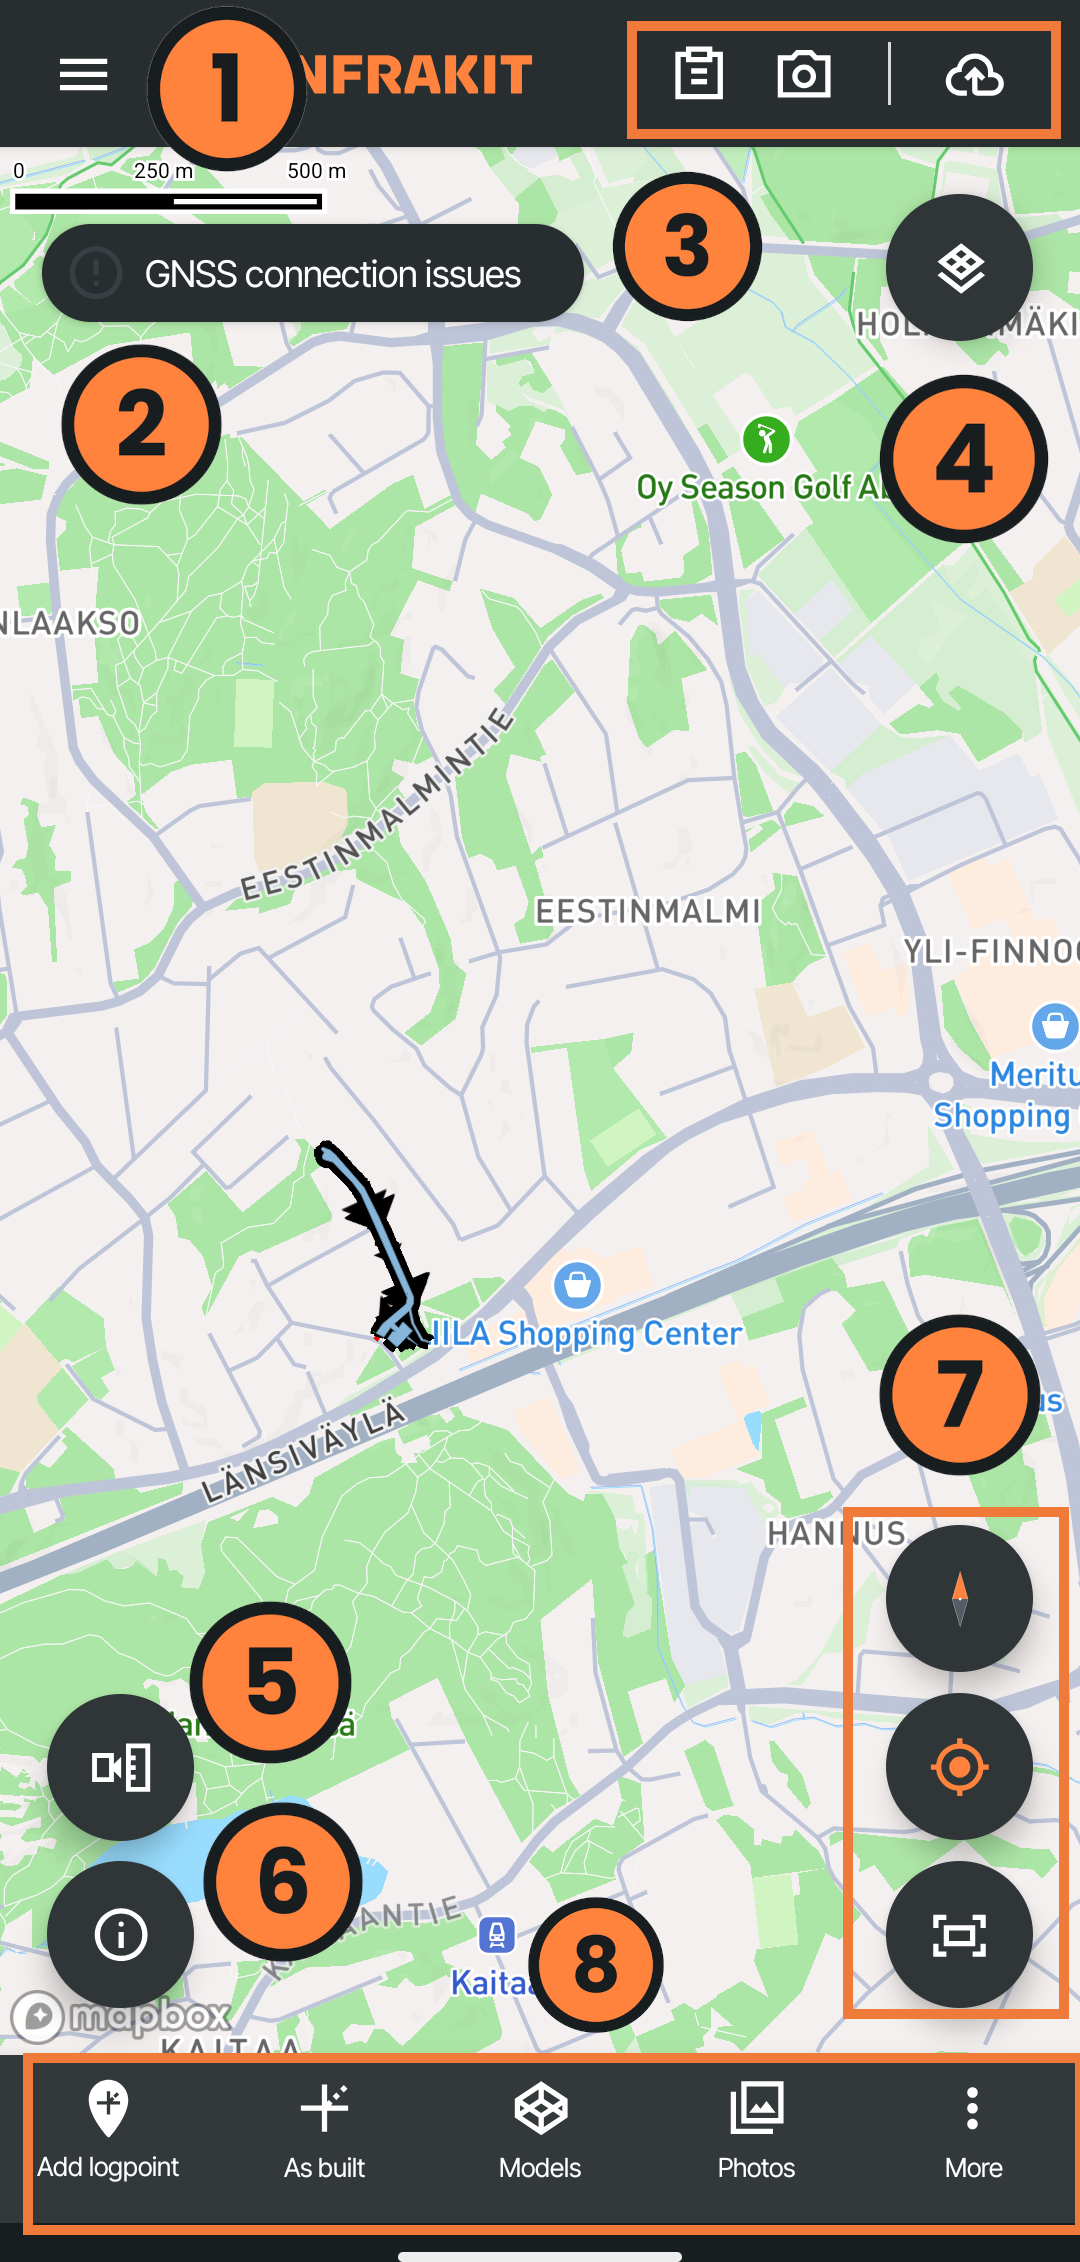
Menu
Connection status
Forms, photo tool and upload queue
Map tile layers
Receiver location info window
User status
Reset compass, zoom to user, zoom to active materials
Toolbar
Folder tree
In many features the application opens the folder tree that can be navigated by following controls:
Scroll the folder tree to see all folders that won't fit on the screen
Click on a folder to show subfolders
Click on an opened folder to hide subfolders
The files inside a folder are always shown under the subfolders
Icons:


The menu for each feature is shown on their own chapter aside from basic navigation
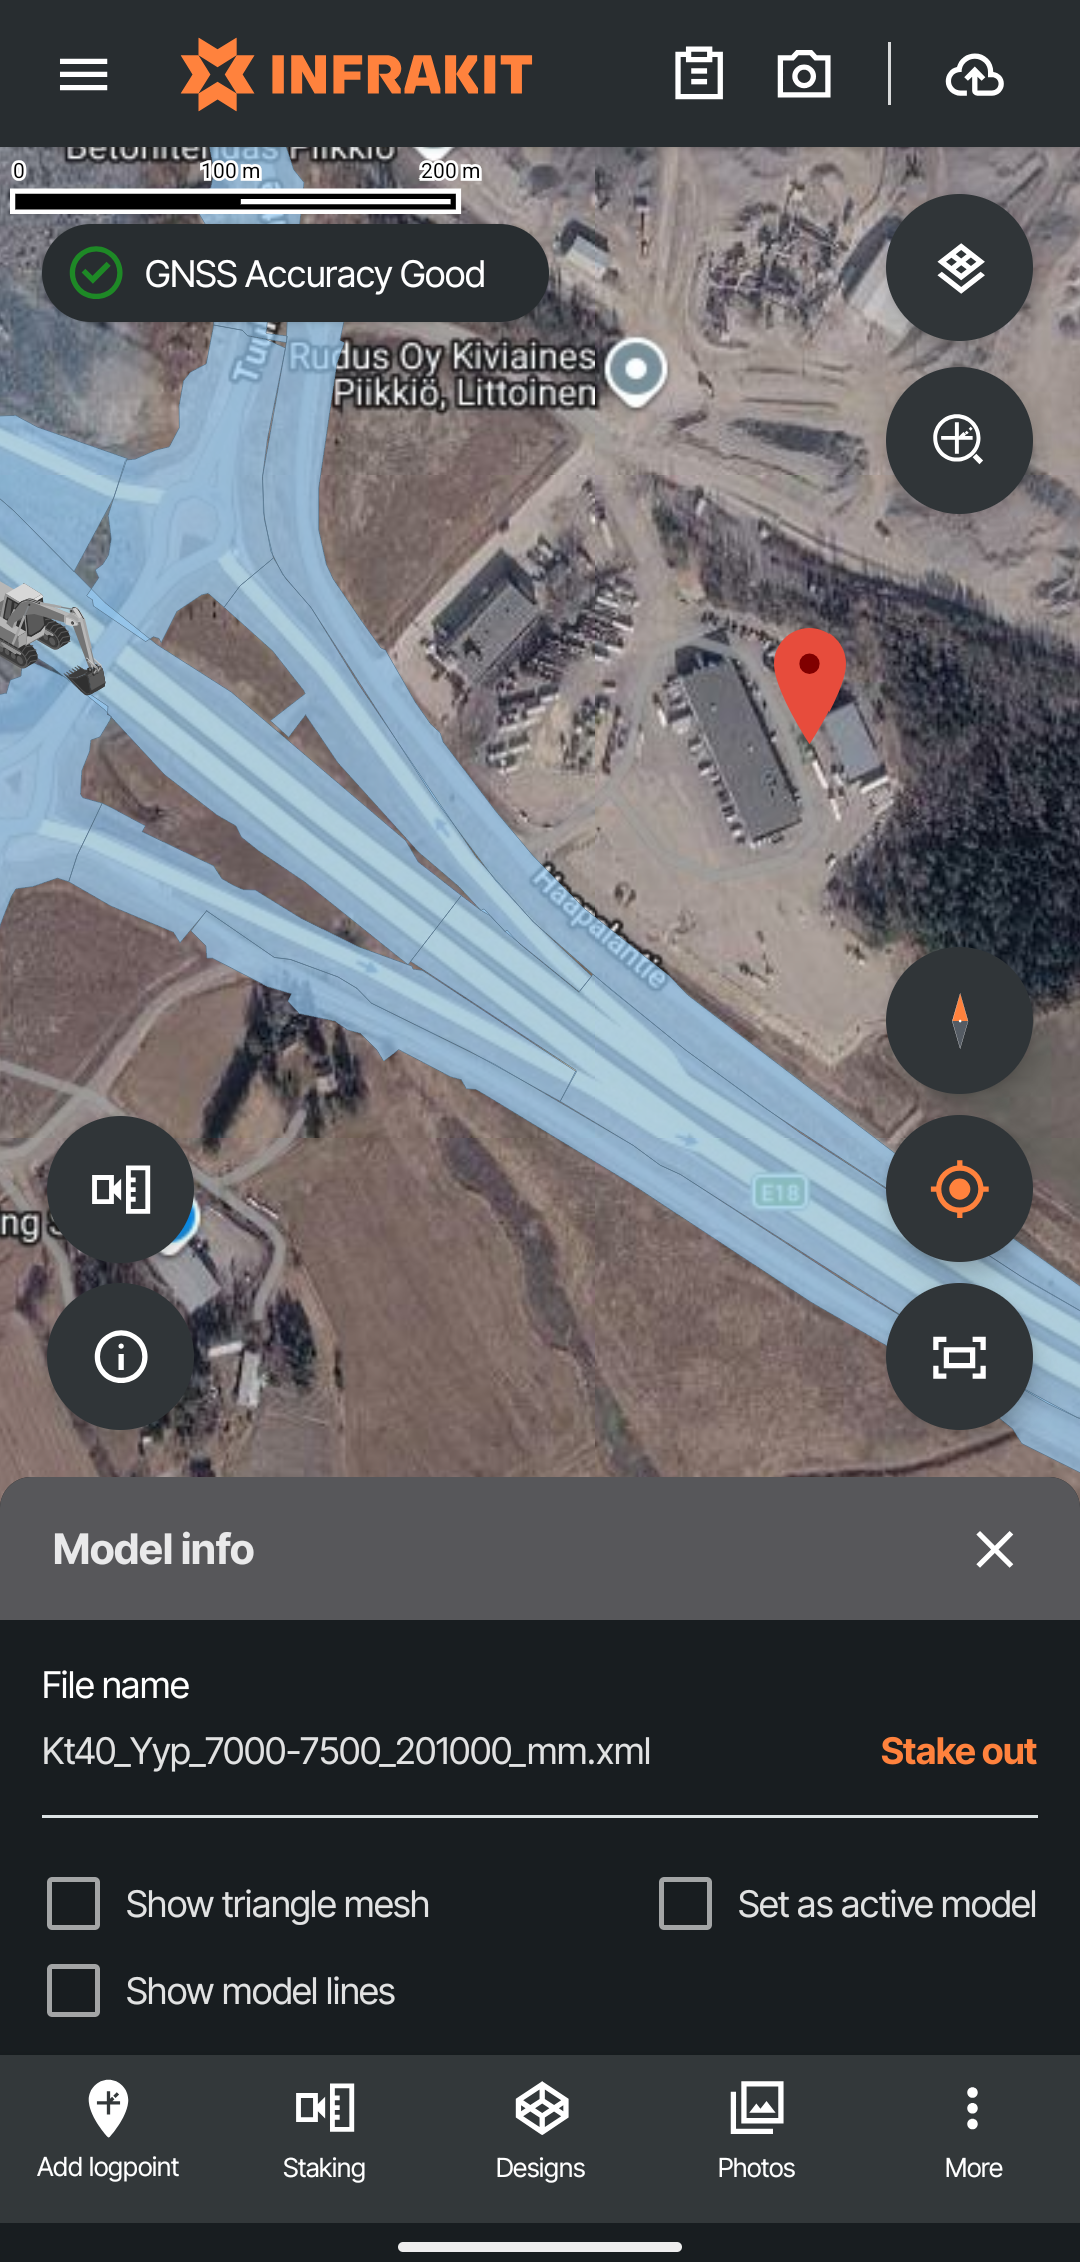
Model info menu
Visualizing models on the map is shown later in the guide
By tapping and holding on top of a model the user can:
Enable or disable triangle mesh of the model
Select or unselect the model as active model
Enable or disable model lines
Enable Stake out mode on the model
If stake out is selected the application will open a new window that prompts the user to select a line that will be used in the stake out
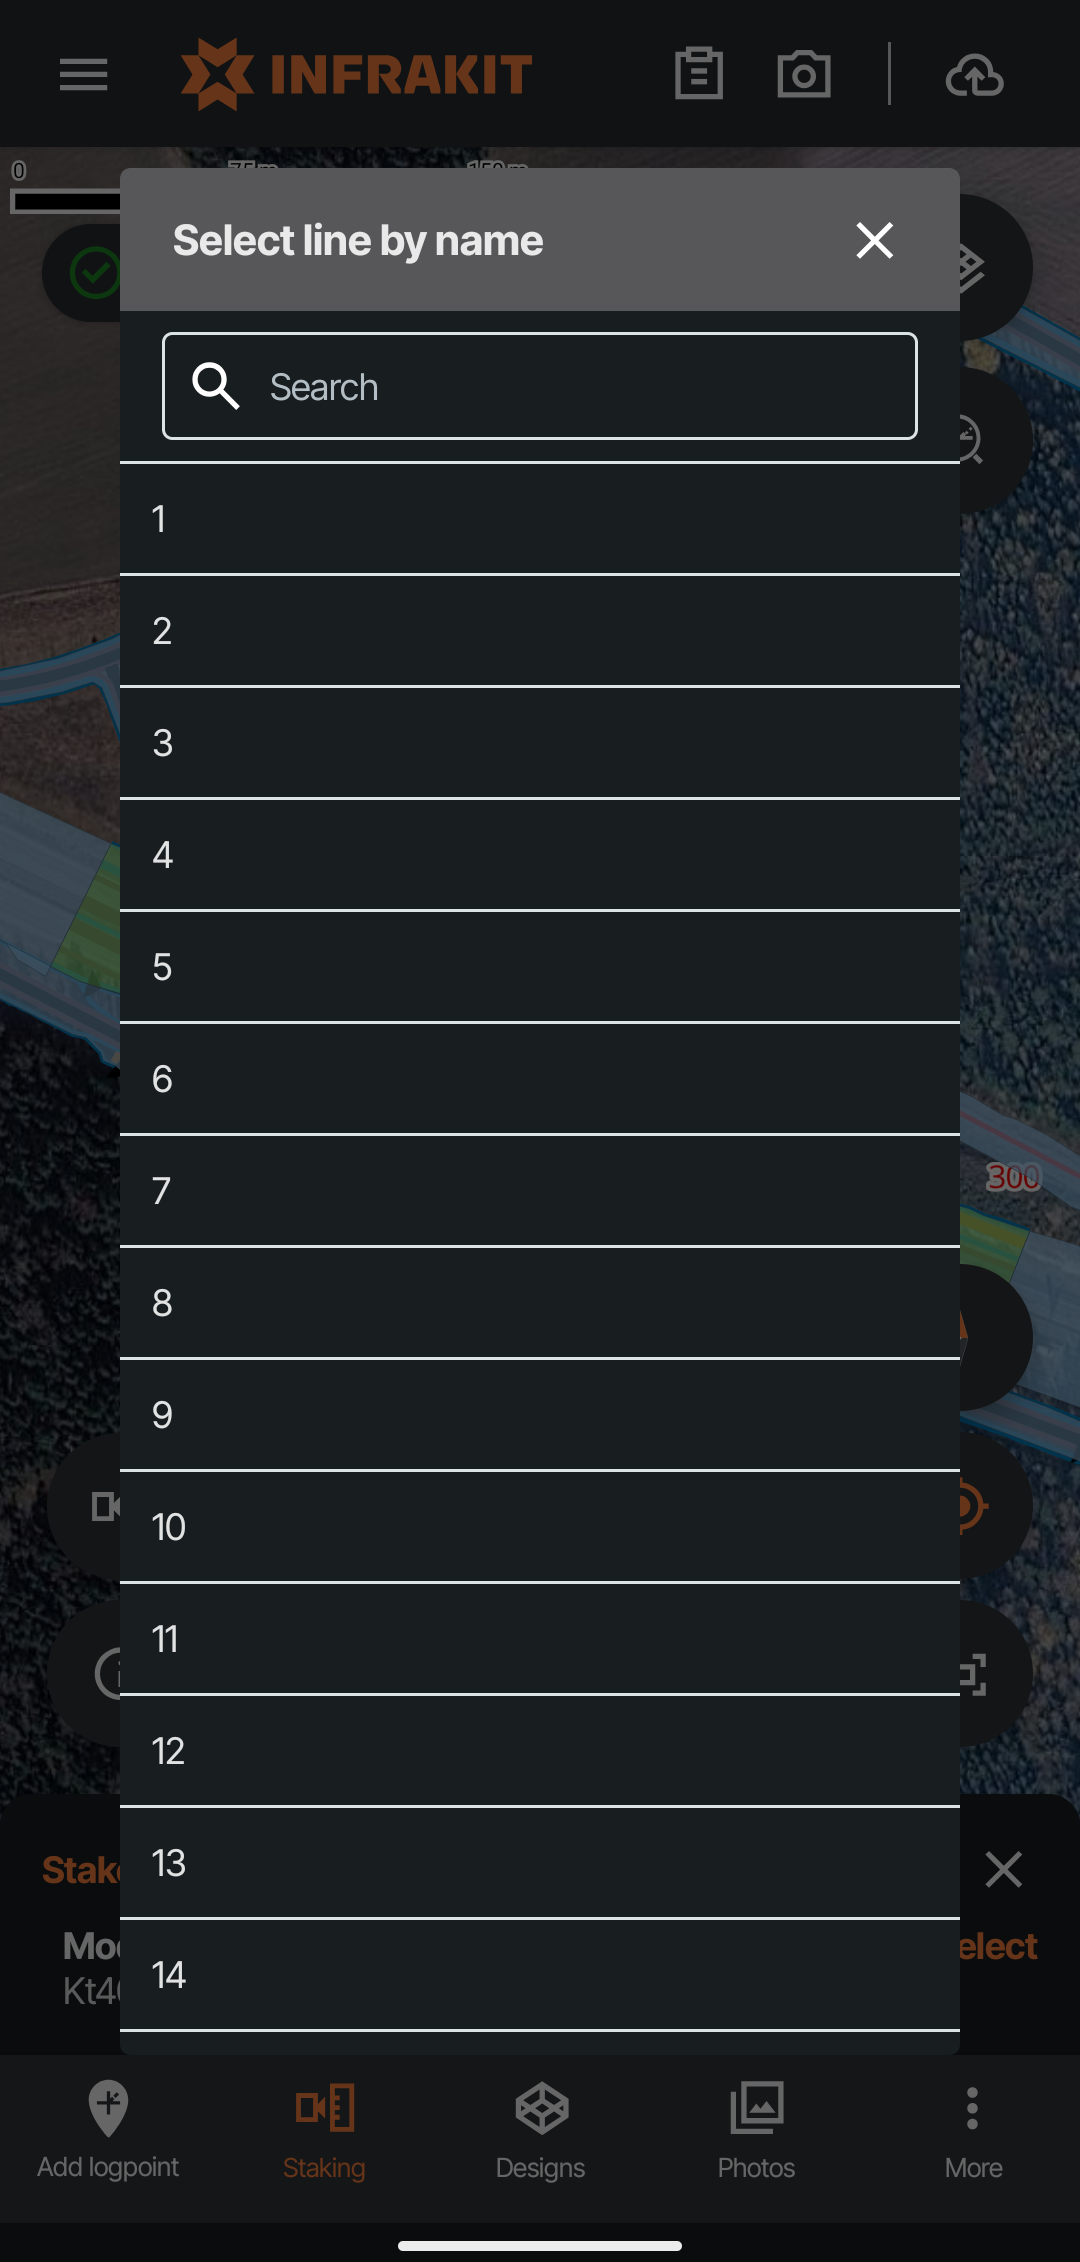
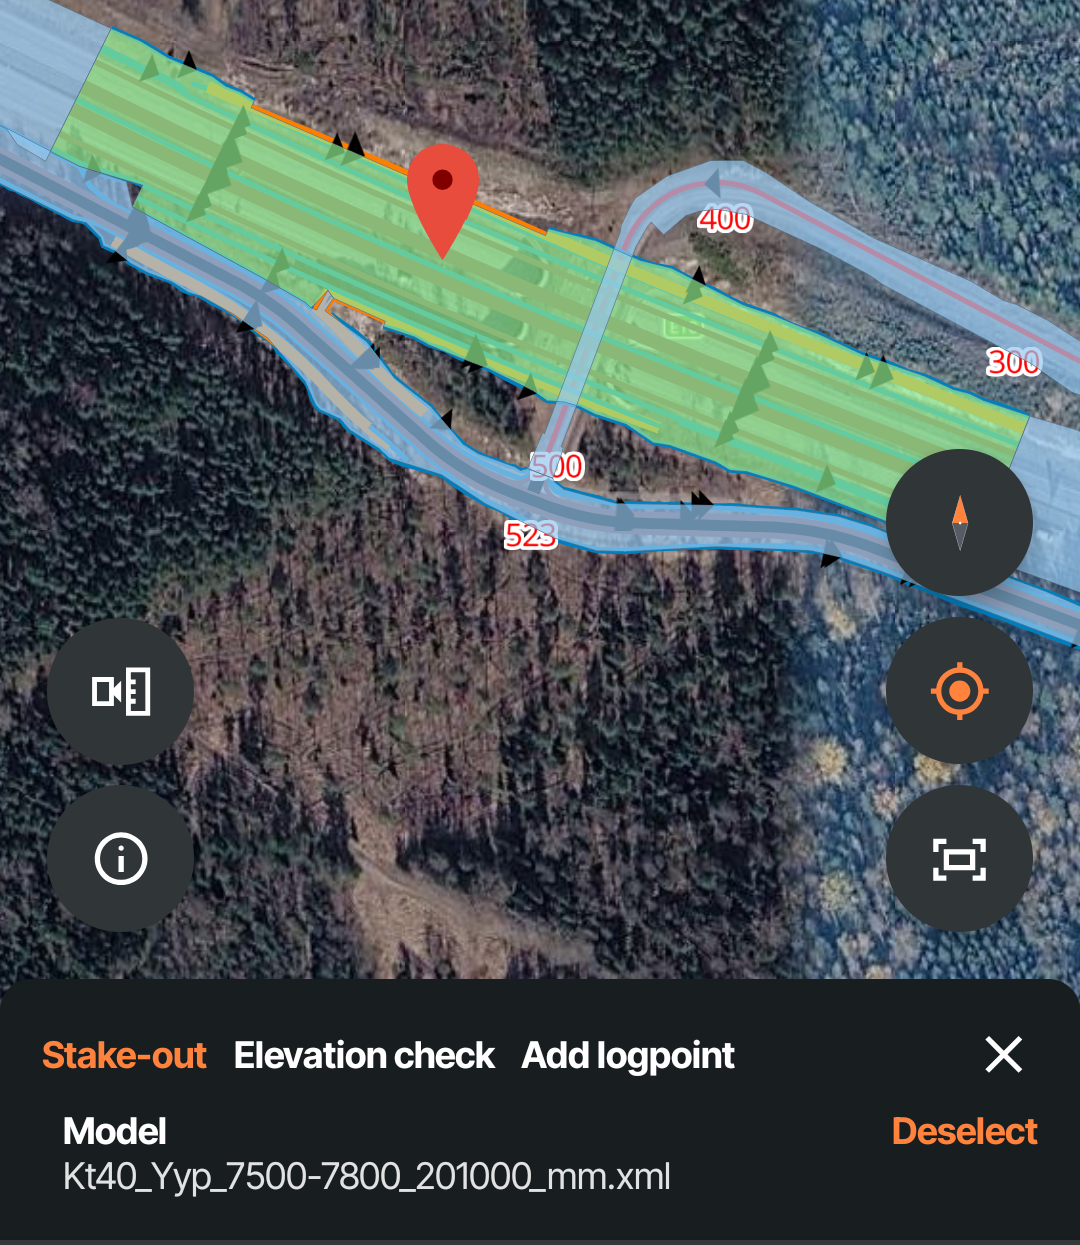
Selecting a model and line automatically sets the selected model active and enables model lines
Model lines
By activating model lines active line can be changed by tapping the line the user wants to activate. This is shown in more detail in the Staking chapter.
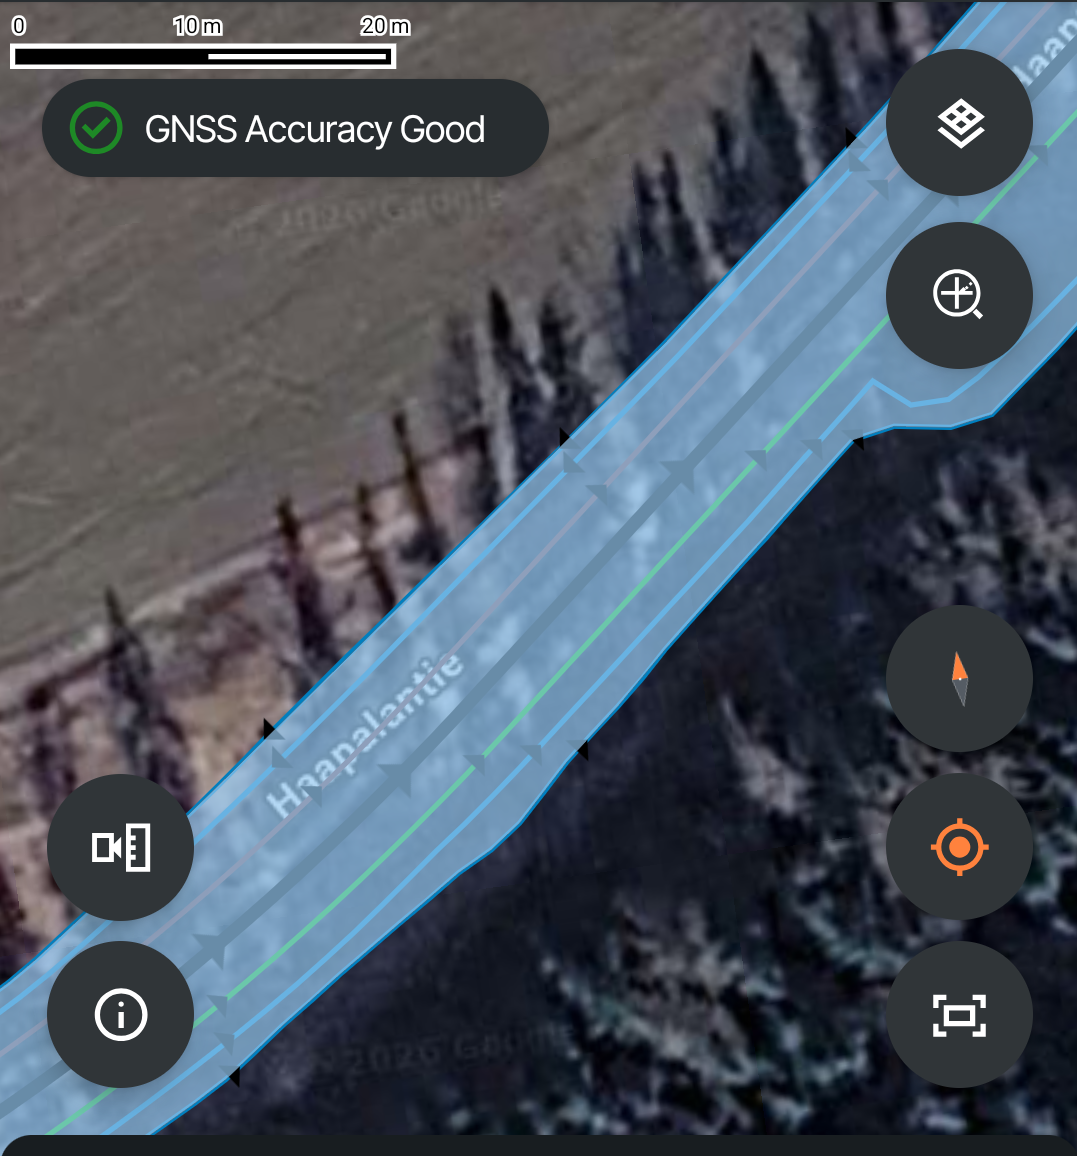
Menu
Clicking on the three horizontal lines opens the main menu from which the user can:
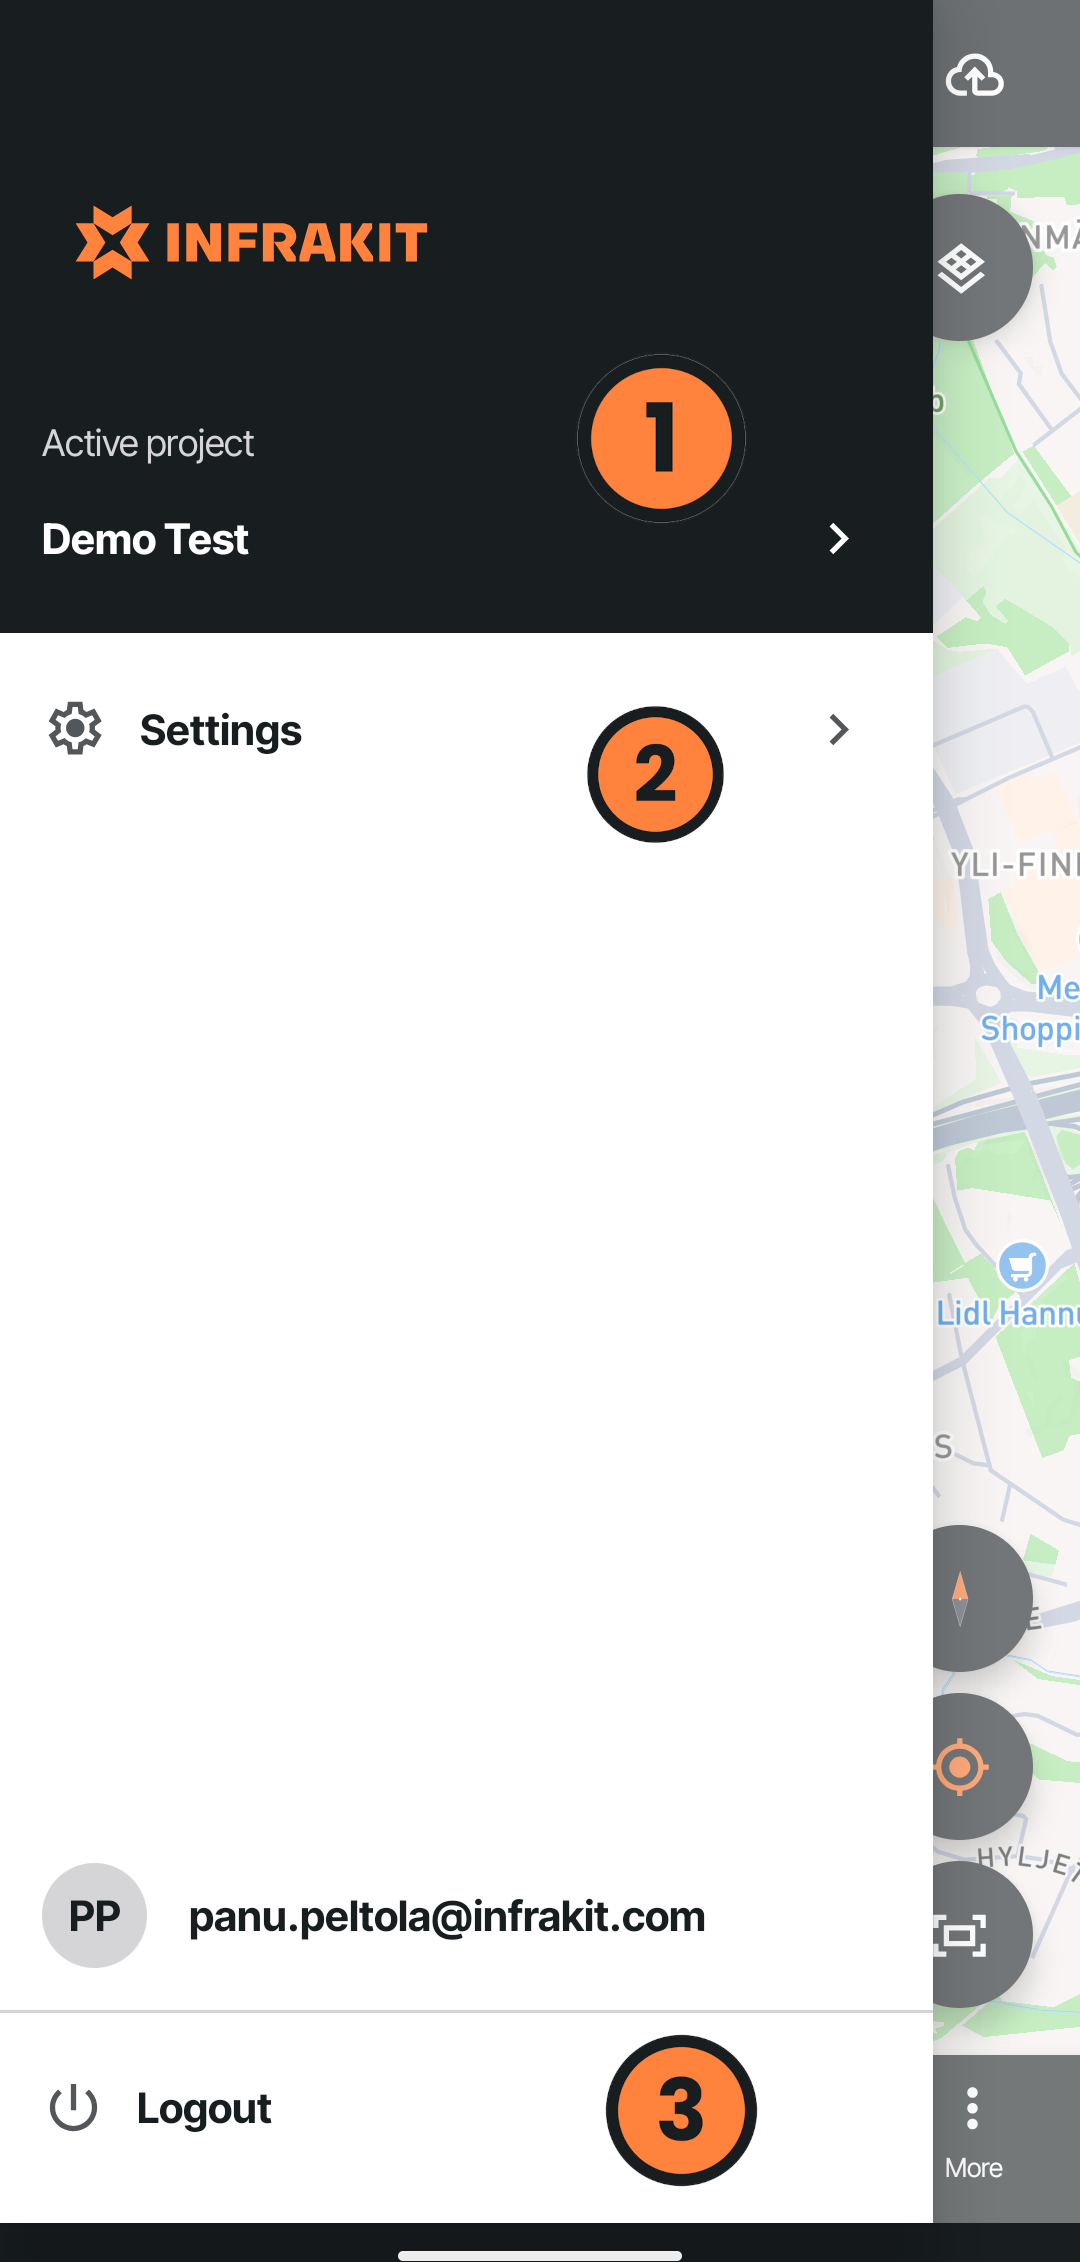
Change active project
Open the settings menu
Logout
Settings
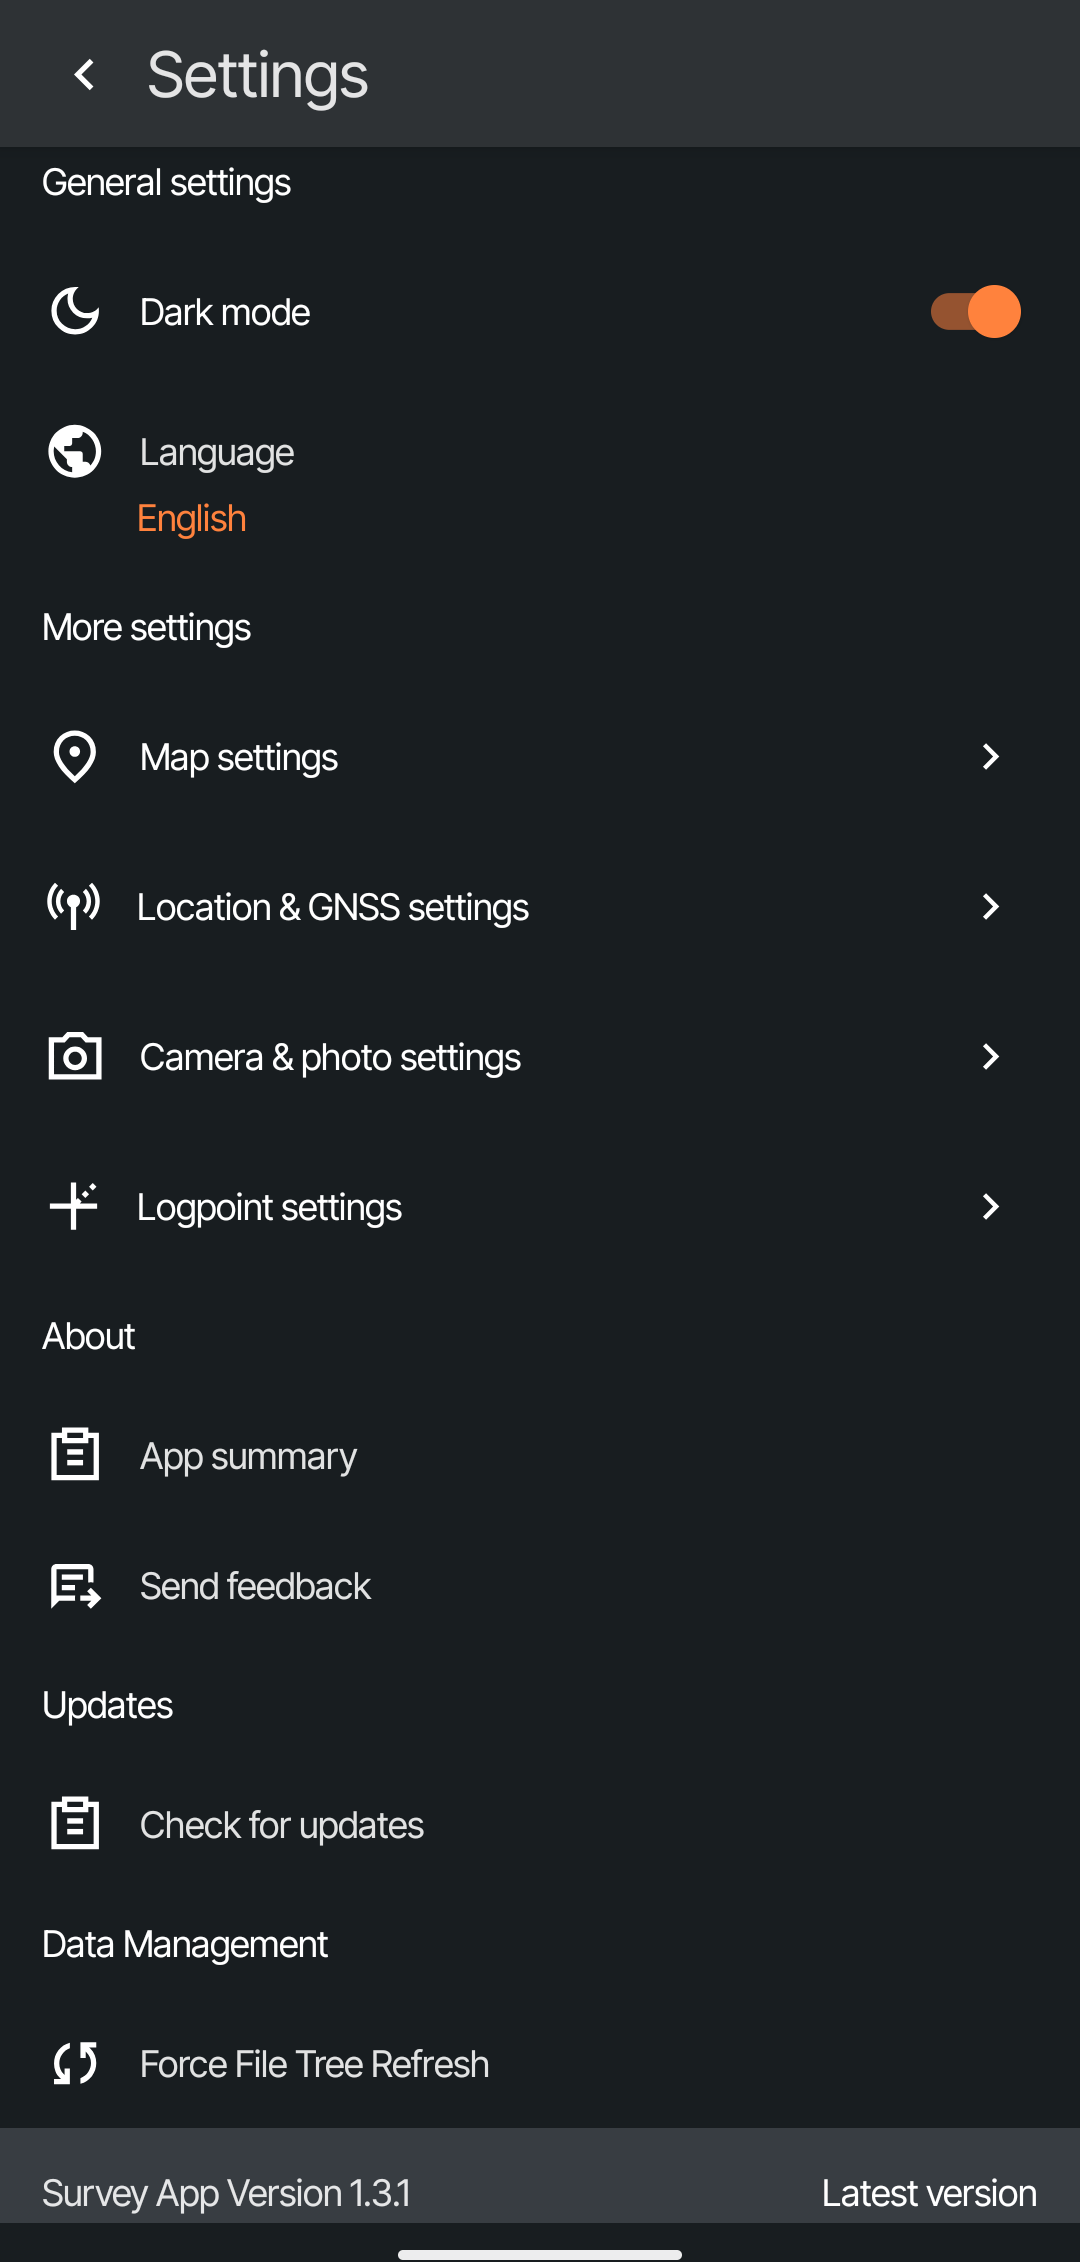
From the settings user can:
Toggle dark mode
Change app language
Change map settings
Change Location & GNSS settings
Change Camera & photo settings
Change Logpoint settings
See App summary
Send feedback to Infrakit
Check if newest version of the application is installed
Force File Tree Refresh
See the version of the application installed
Map settings:
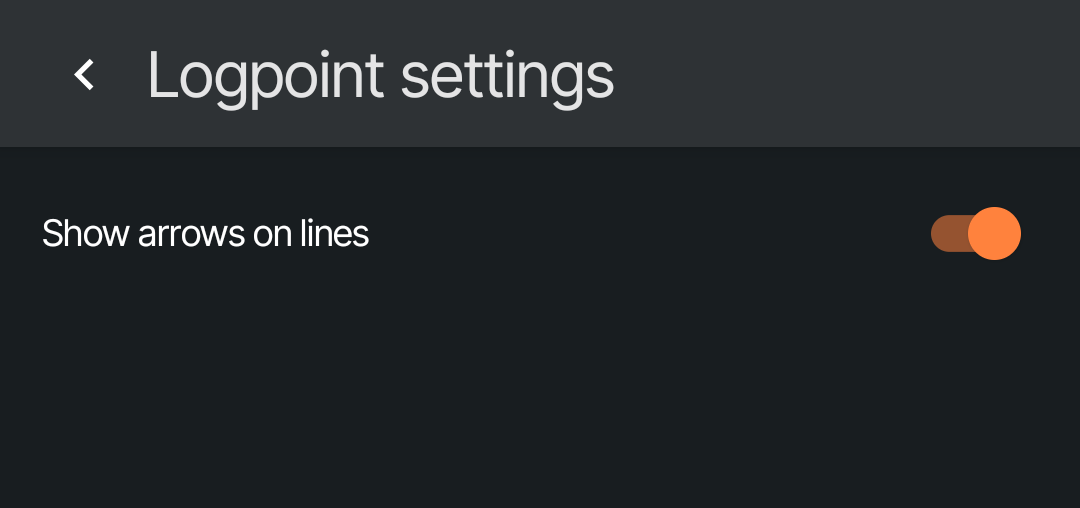
From Map settings the user can choose if they want arrows to be shown on lines. Lines indicate the direction of the line.
Location & GNSS-settings
To see our guide on Location & GNSS-settings see page
Other options
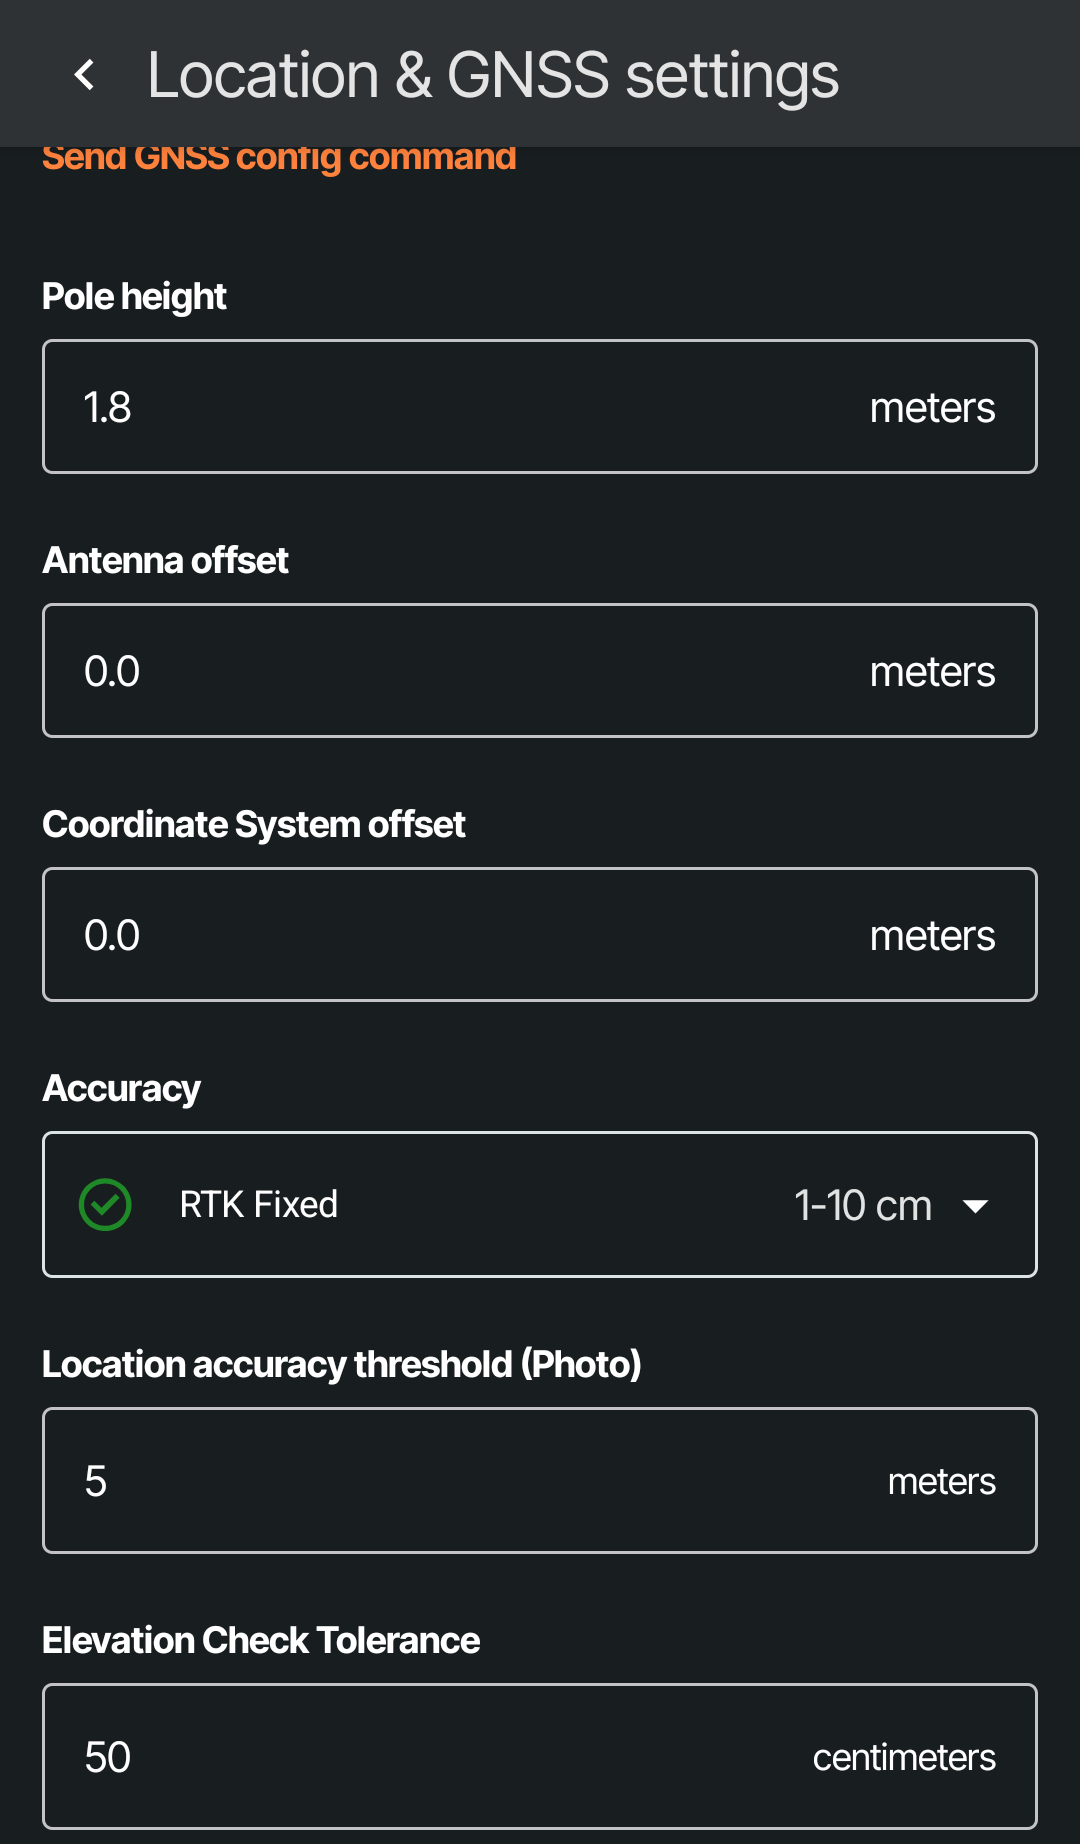
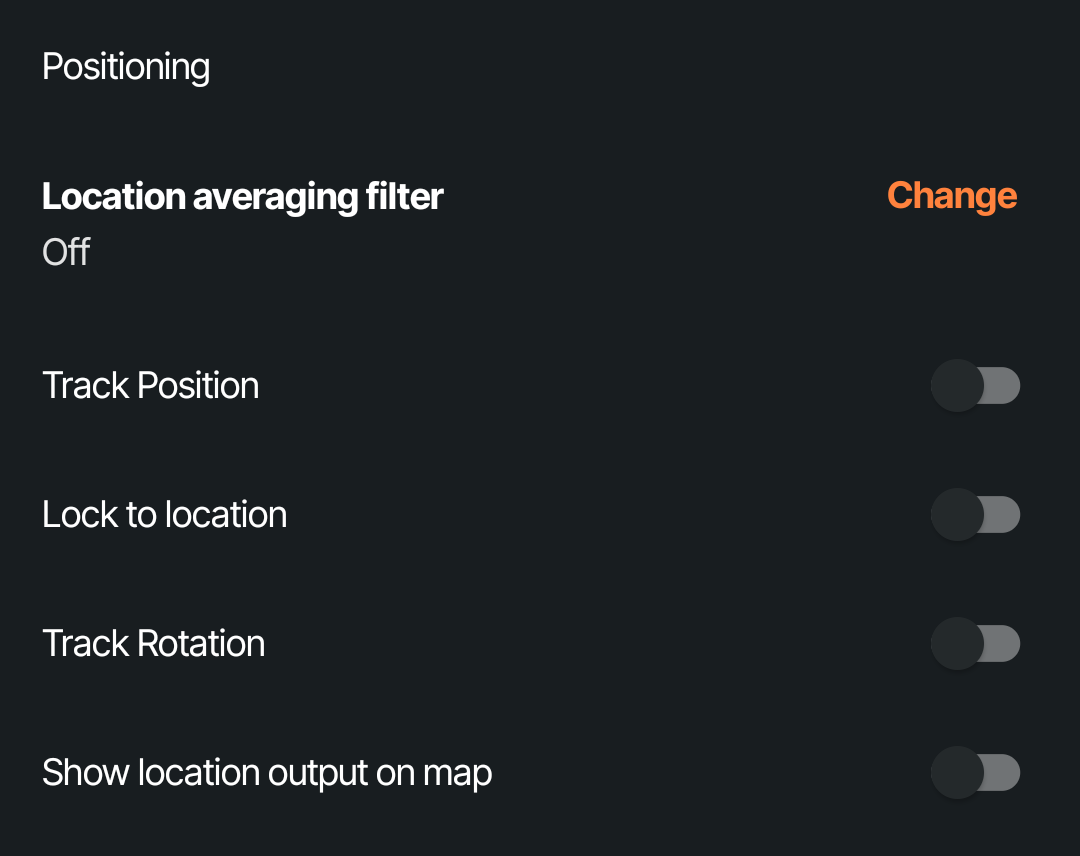
Pole height | Set the height of the pole, see instructions from the vendor |
Antenna offset | Antenna offset decreases the height of measurements, may be used if antenna increases the height of logpoints |
Coordinate System offset | Coordinate offset decreases the height of measurements, may be used if coordinate system height needs an offset |
Accuracy | Select the accuracy the receiver needs to be at for the application to not warn about inaccurate measurements |
Location accuracy threshold (Photo) | The required accuracy of location for the application to not warn about during taking a photo |
Elevation check tolerance | The tolerance that is used with the stakeout mode |
Location averaging filter | User can select a time interval that is used to calculate average of measurements made that is shown as the location. If the filter is not turned on, the application will always show the raw location given by the receiver |
Track position | Tracks the position of the user and centers the map back to the user's location every few seconds |
Lock to location | Locks the map to the location the user had while toggling this option on. If both track position and lock to location are enabled, the track position option overrides the lock to location option |
Track rotation | Rotates the map on the application with the direction of the user's device |
Show location output on map | ? |
Logpoint altitude=Measured altitude - Pole height - Antenna offset - Coordinate offset
Logpoint settings
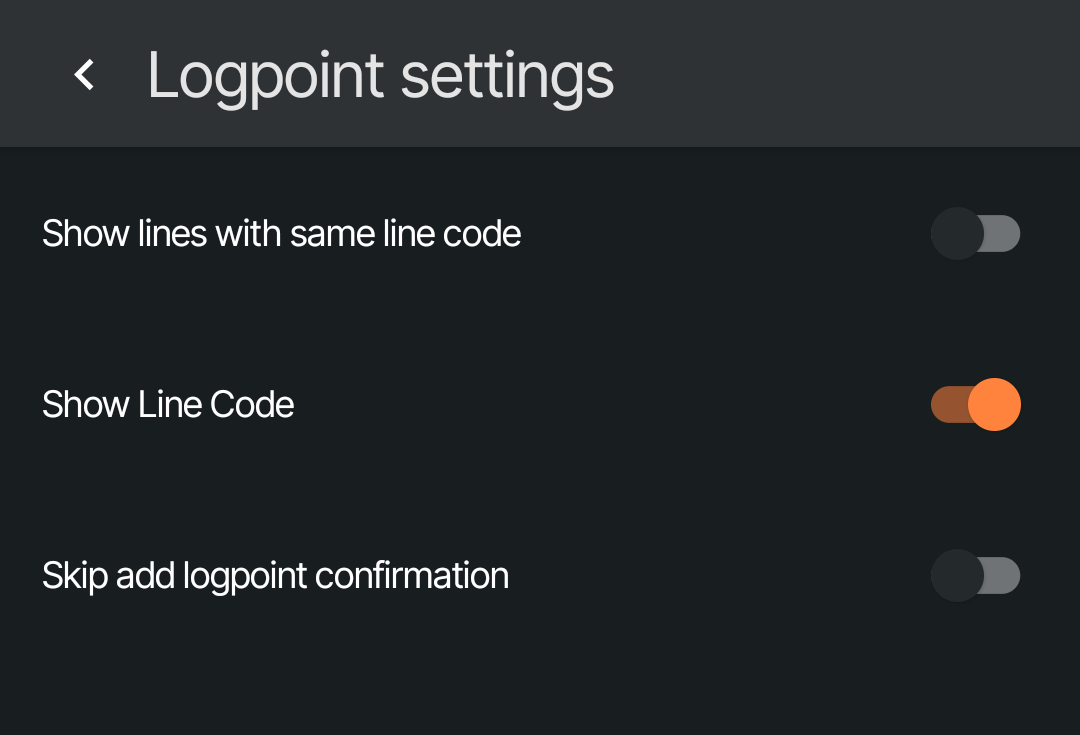
Logpoint allows the user to toggle options used with logpoints
Show lines with same code
Show Line Code
Skip add logpoint confirmation
Connection status
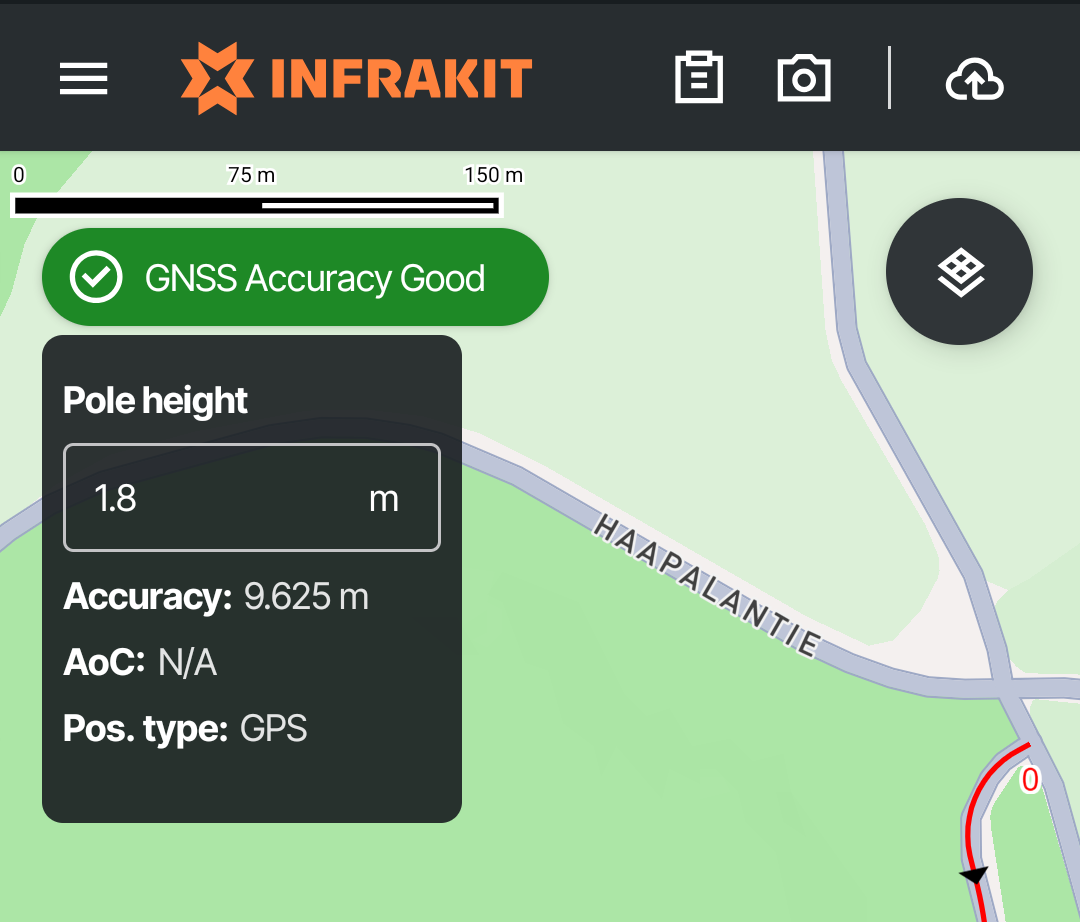
Connection status enables the user to see the set pole height, calculated accuracy of their device and position type. Pole height can be changed from this window.
This window will also show if accuracy is good enough according to the threshold set in the settings. Connection status will show the status of RTK.
Forms, photos and upload queue
The three buttons on the top right corner of the screen open the tools to fill forms using Infrakit Forms tool or fillable PDF-files, take pictures or see the status of files uploaded to Infrakit from the device.
A guide to use these will be put here once.
Receiver location info window
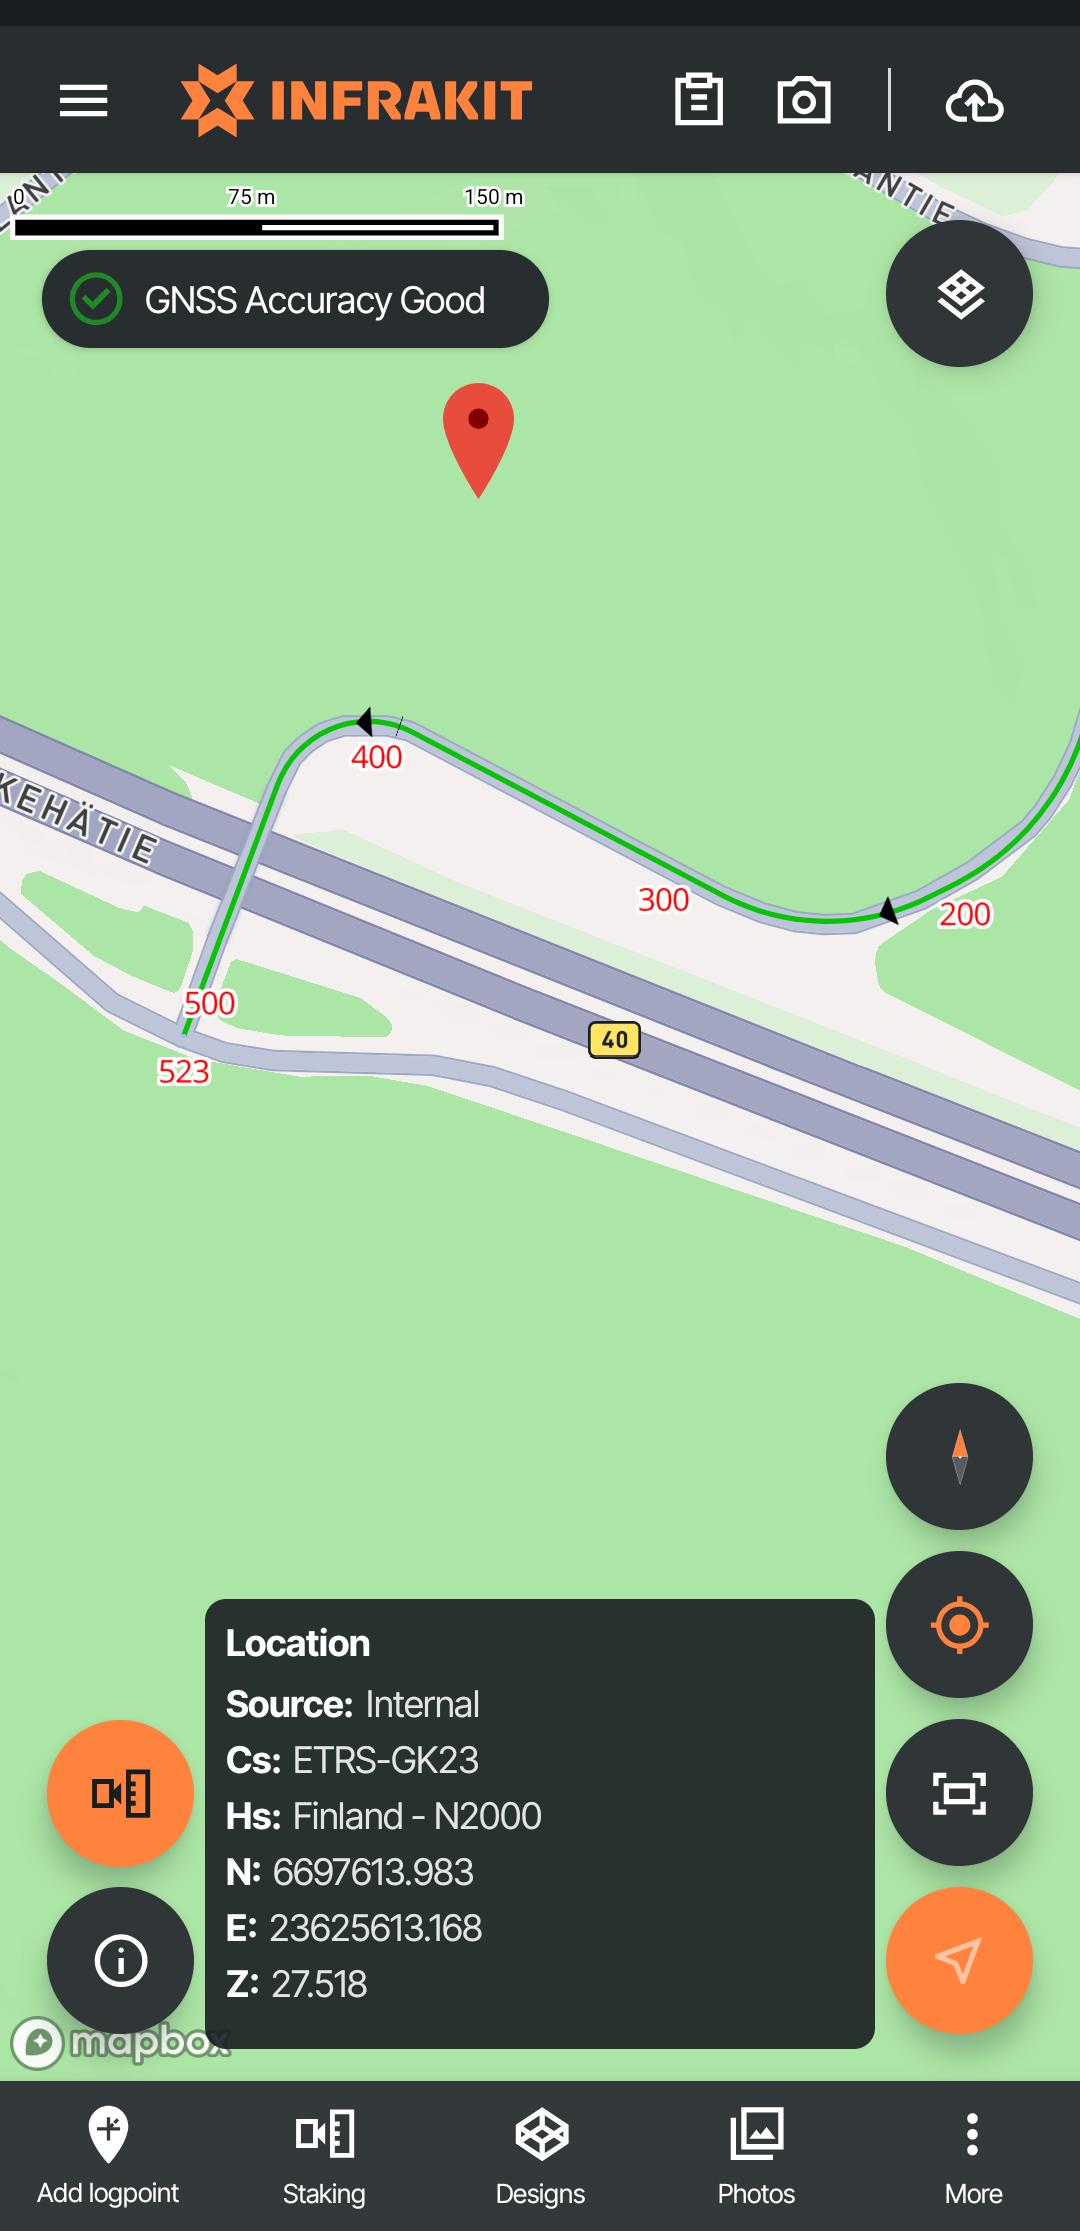
By tapping the highlighted icon on the lower left side of the screen the user can see the source of location the device is using, coordinate systems and the calculated location of the device.
User status
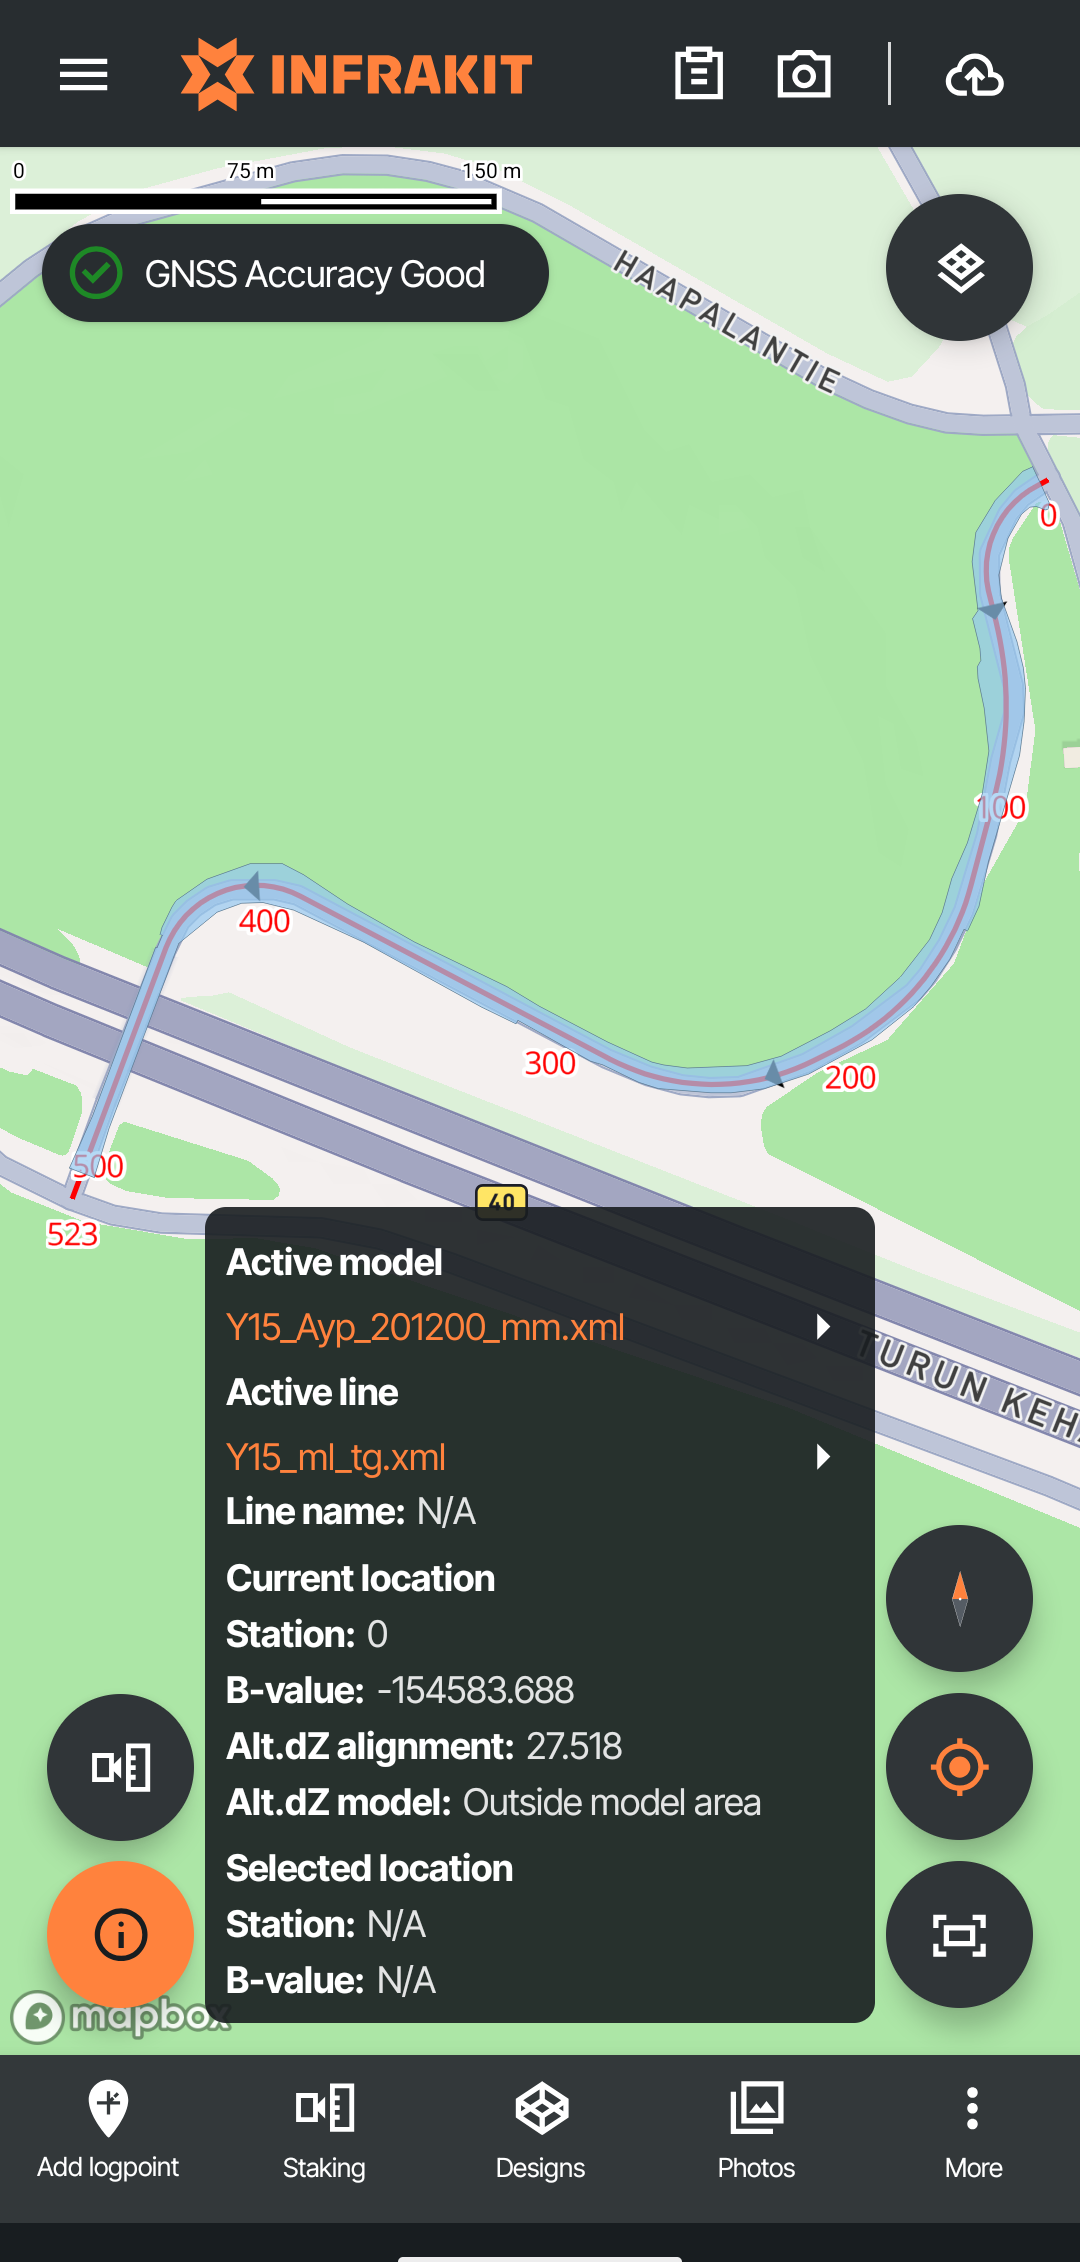
By tapping on the highlighted icon the user can:
See active model and change it
See active line and change it
See current location compared to the line
See the station and B-value of selected point on map
Map layers
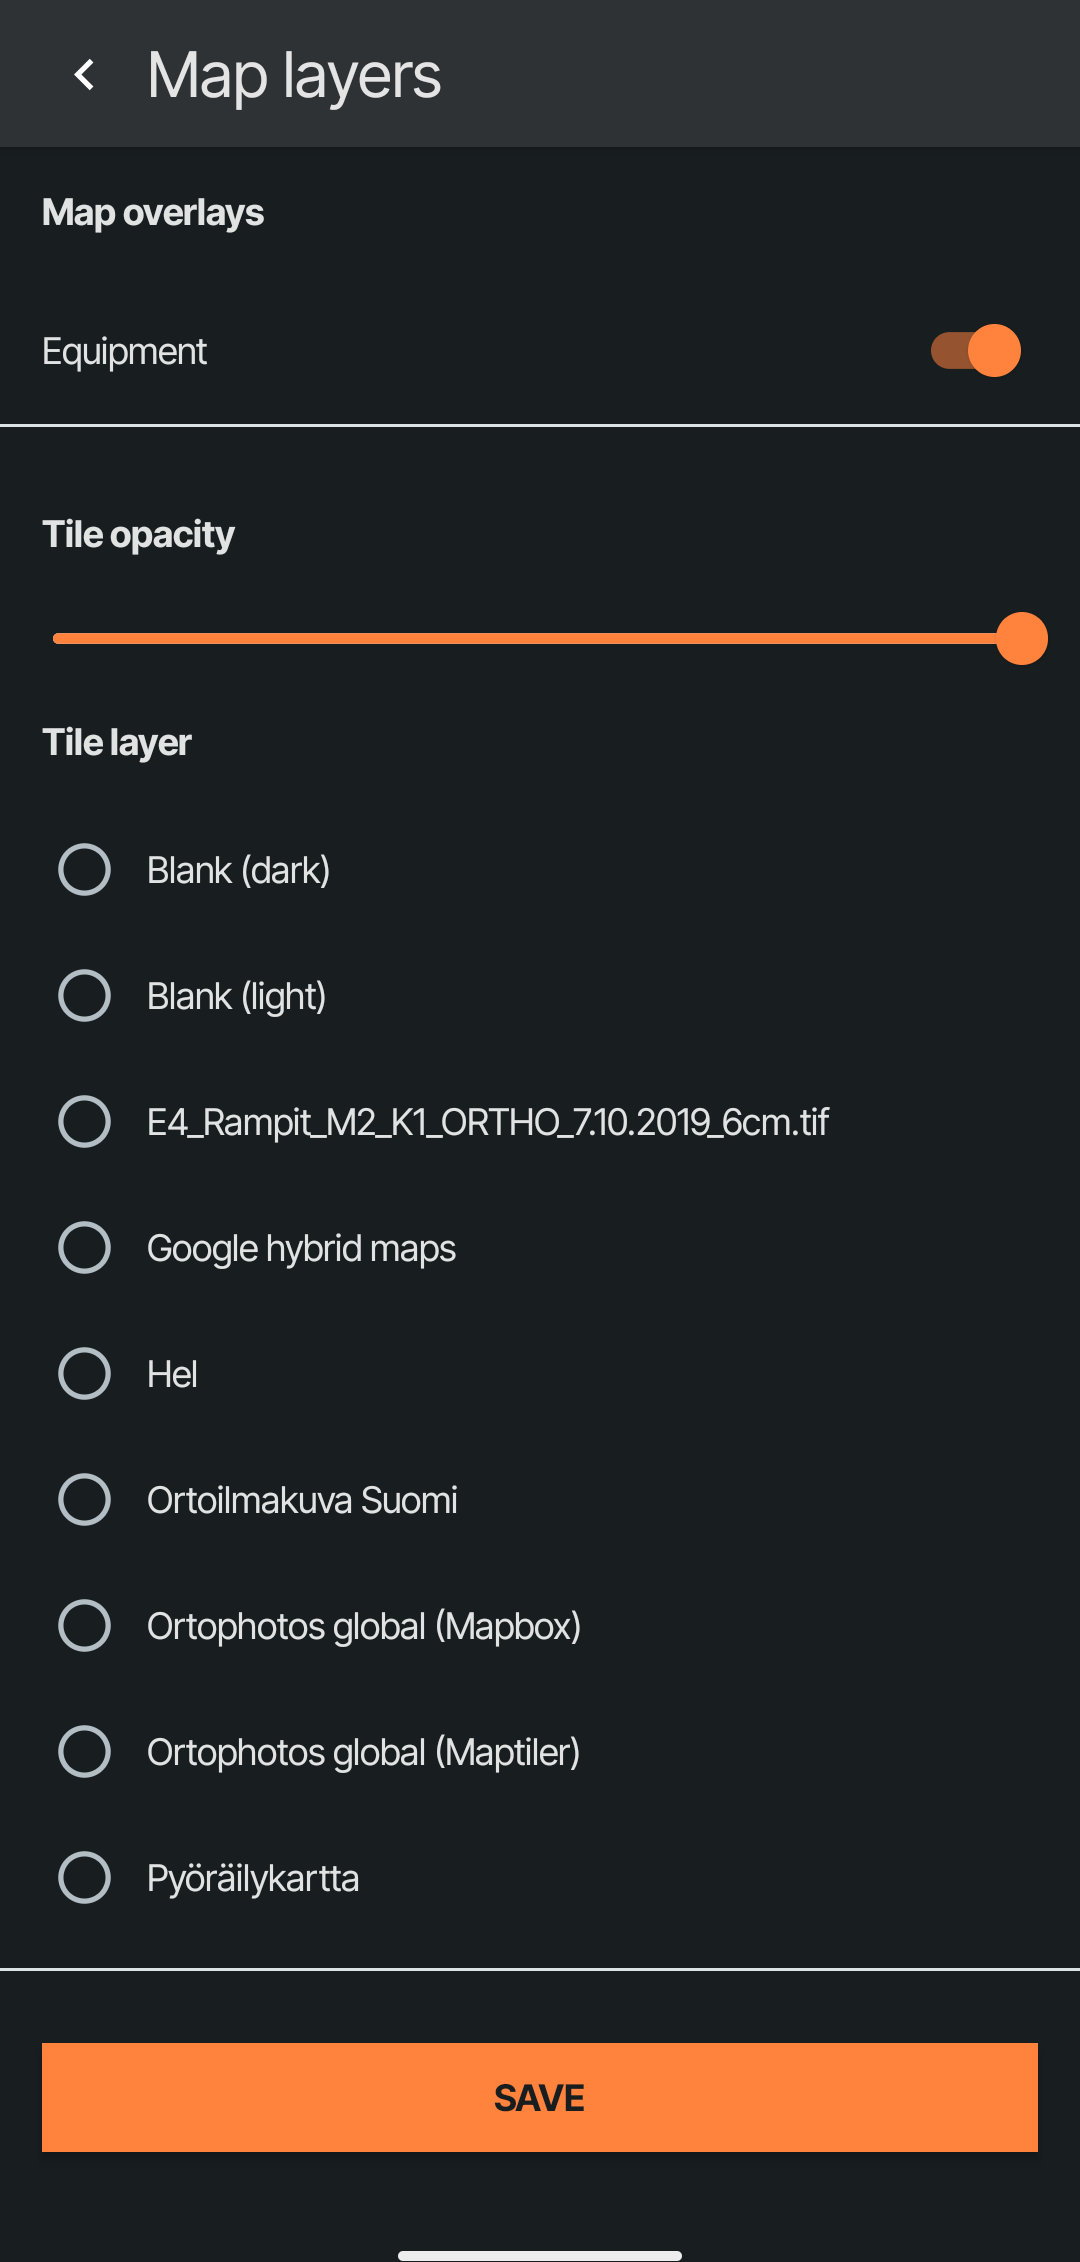
From this menu the user can toggle if equipment is shown on map, select the shown map tile layer is its' opacity
Toggle equipment visibility by tapping the slider button
Toggle tile opacity by dragging the ball on the slider bar. Slider range is 0% (on the left) to 100% (on the right)
Map layer list can be scrolled if all of the map layers on a project don't fit the screen
Map layers can be map tile layers, orthophotos or point clouds
Only one map tile can be selected at a time
A background map is always enabled even if no map tile layer is selected
In Infrakit Office, you can add map layers by uploading point clouds or orthophotos, or by adding XYZ/WMS map links.
Toolbox
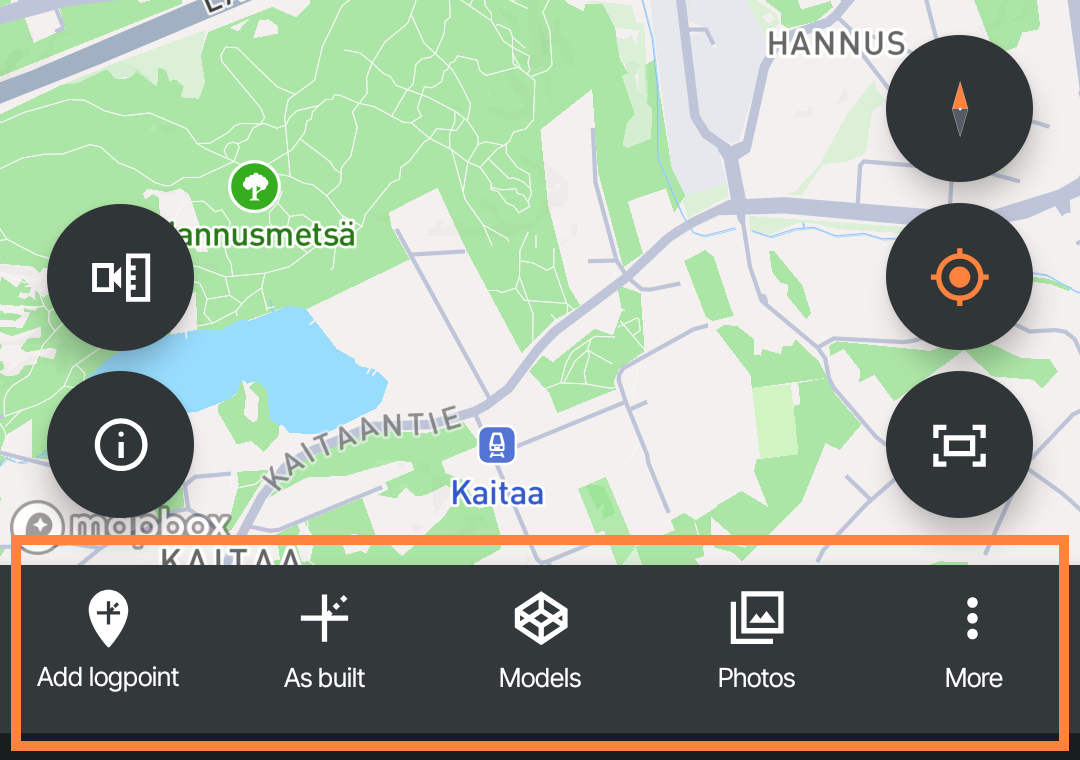
Toolbox can be found from the bottom of the screen.
Four features that are set for quick access are always shown on the toolbar. All tools can be seen by tapping on the "More" button.
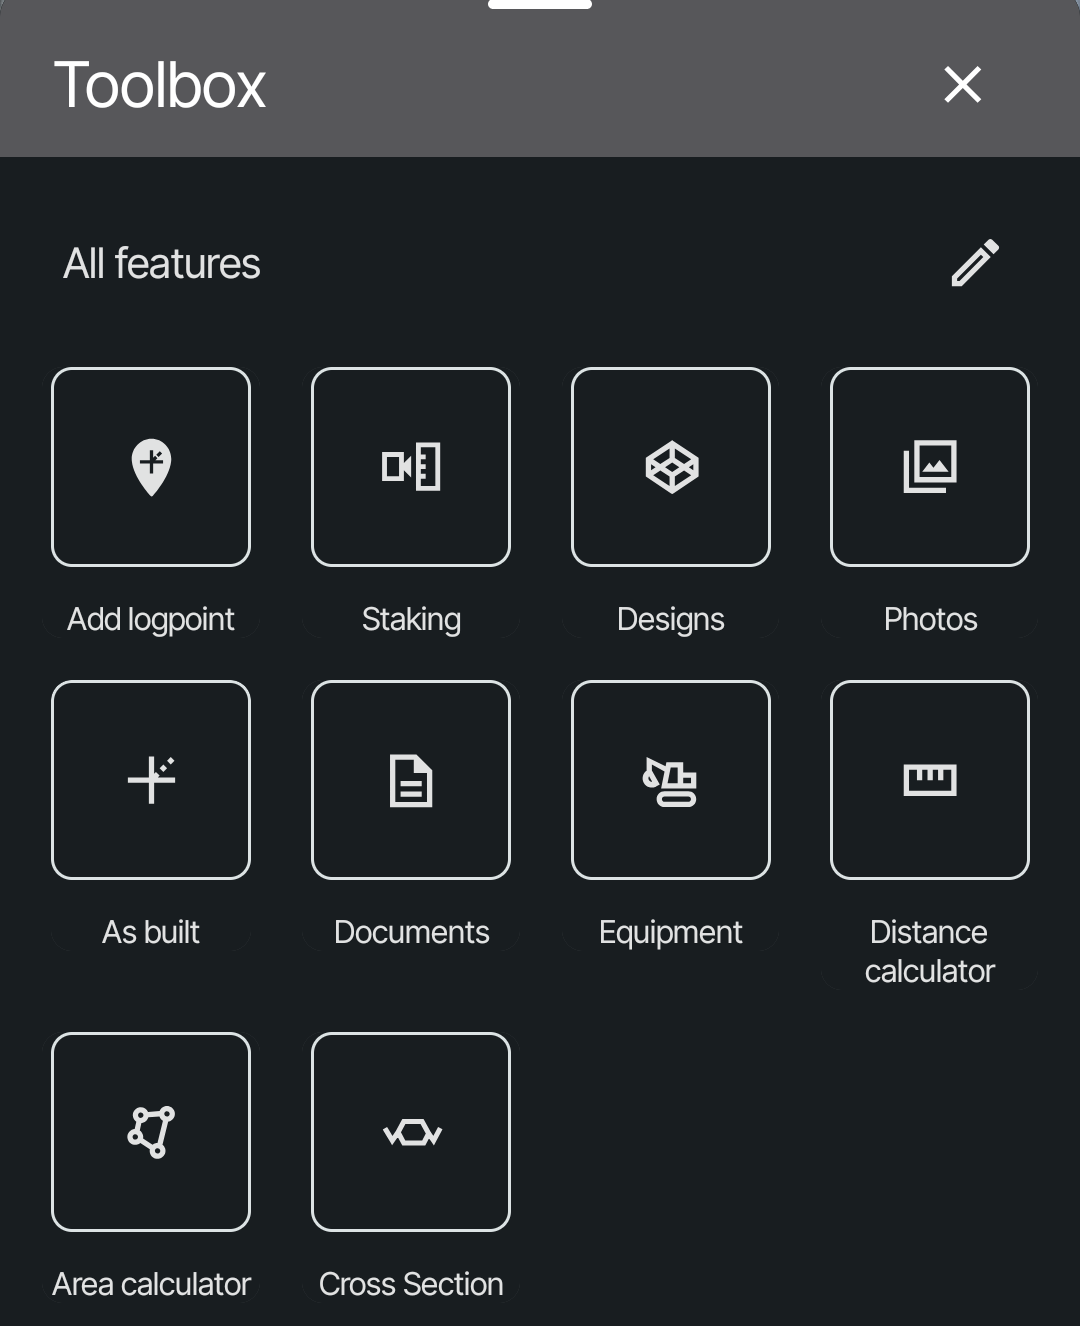
The features can be reordered by selecting the pencil icon on the top right corner of the tool box. While in edit mode, the features can be reordered by pressing and dragging the icons. The features in the top row are the ones that are shown on the toolbar while it is not expanded.
The reordering window can be closed by selecting the backwards arrow on the top left corner of the toolbox.
Designs
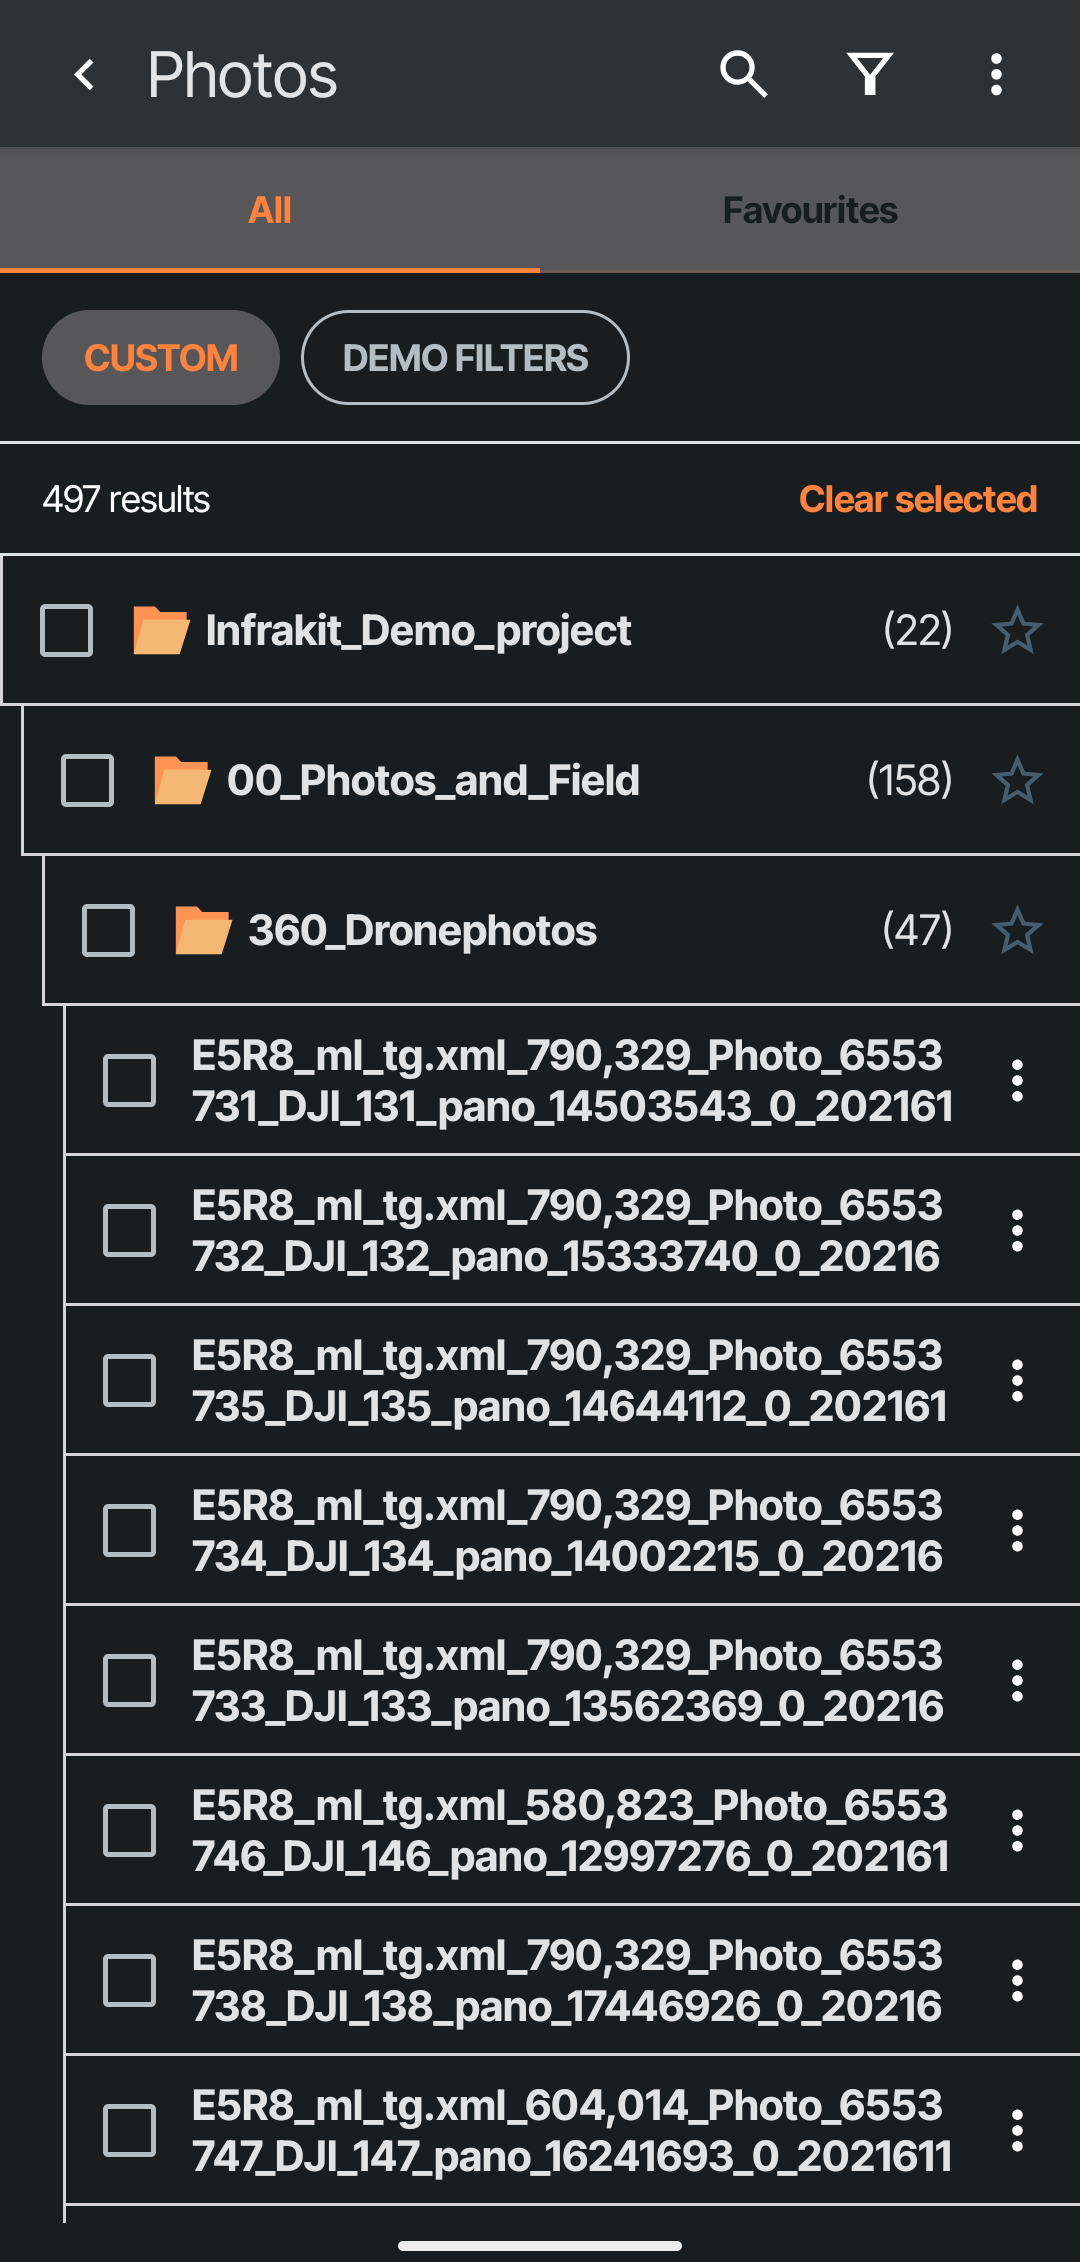
In the designs menu the user can select which models and drawings are visualized on the map. The designs can be visualized by tapping on the box to the left of the name of the model and hidden by selecting the same box again.
All designs from a folder can be activated at once by clicking on the check box left of the name of the folder.
Folders with the star icon on the right enabled will be shown on the "Favourites" tab on the top of the screen.
All selected models can be cleared by tapping on the "Clear selected" button
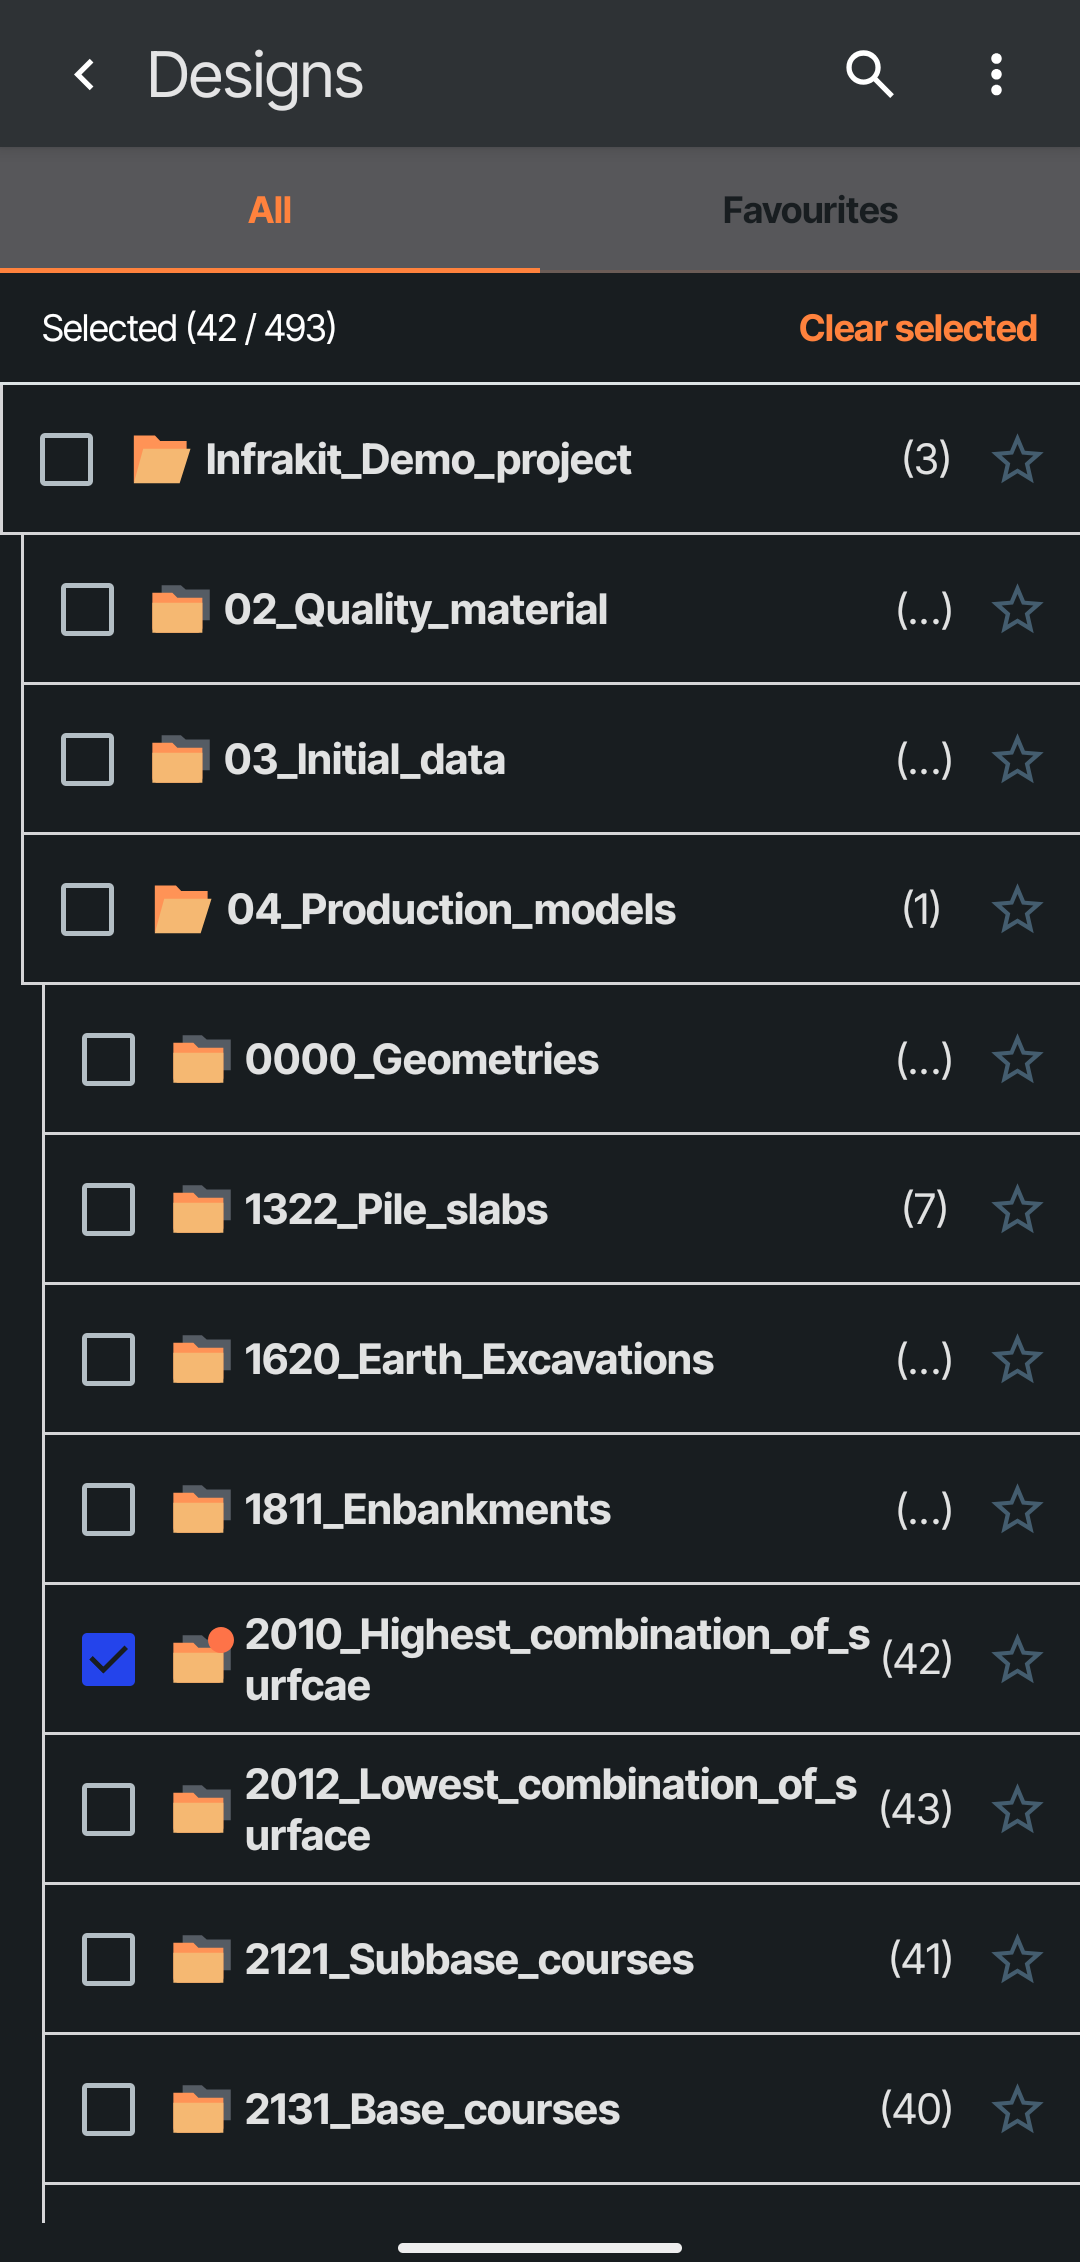
Models and folders can be searched by tapping on the magnifying glass icon on the top right corner of the screen
The numbers in parentheses display how manu files are inside a folder. The three dots means there are subfolders inside the folder but no desings.
More options can be accessed by selecting the three dots on the top right corner of the screen
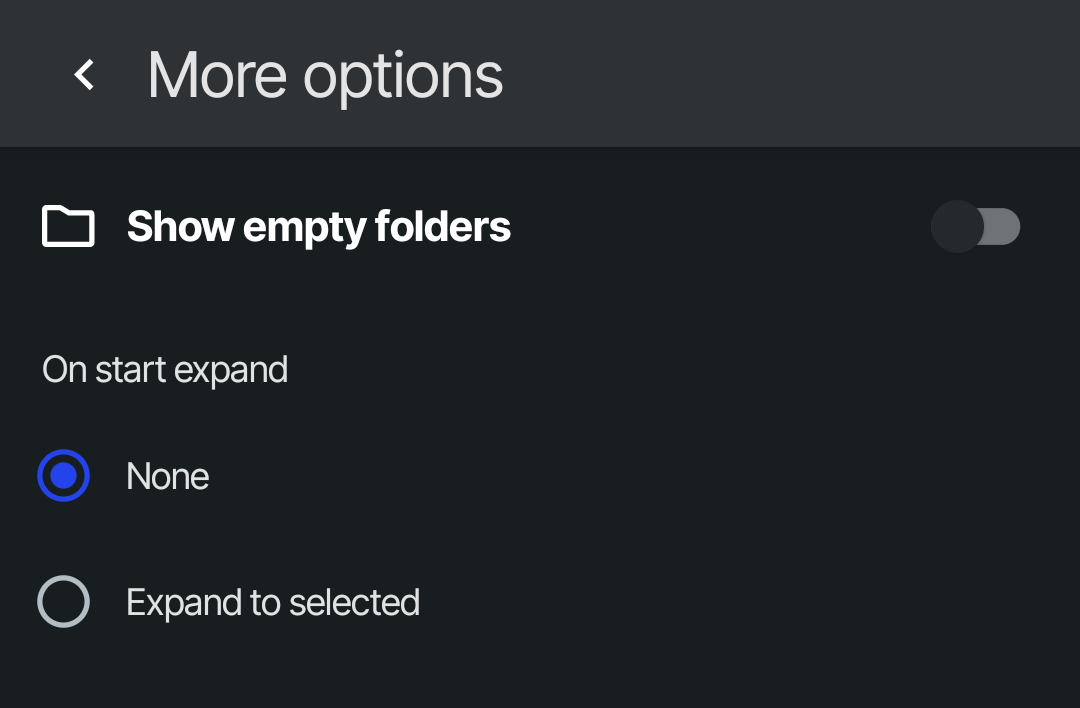
In this menu the user can select if folders without designs that can be visualized are shown and select if the folder tree expands to selected as the designs menu is opened.
Photos
Photos allows the user to visualize photo icons on map and open them on the application.
360-photos can be viewed in Survey application but they will be handled as normal photos without panoramic effects.
Photos menu
To activate photos on the map select enable the checkbox next to its' file name or enable a full folder the same way.
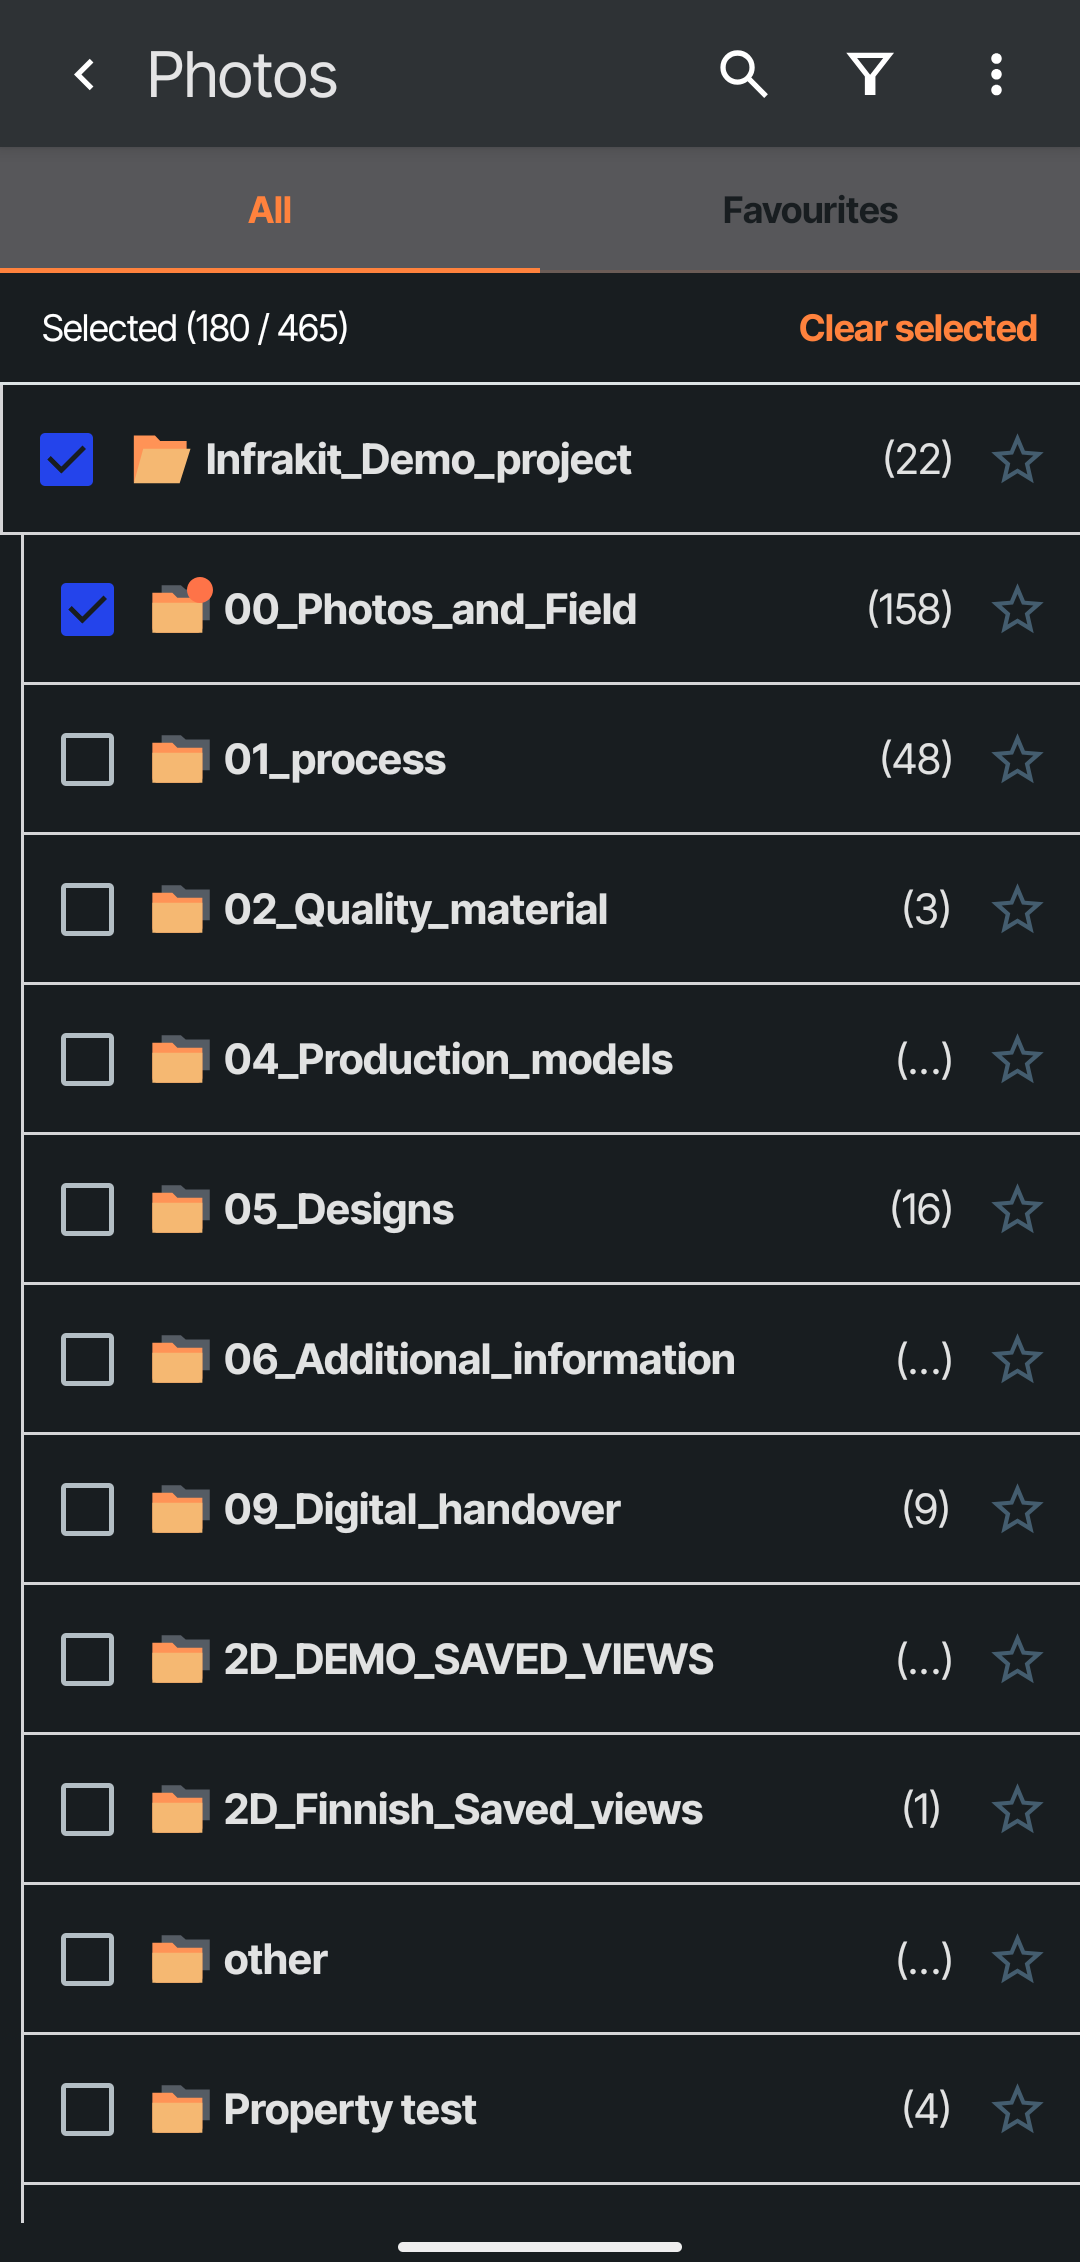
Photos menu is otherwise identical to the designs menu except it has the option for filters to be applied. To configure filters tap on the syphon icon next to the magnifying glass icon on top of the screen.
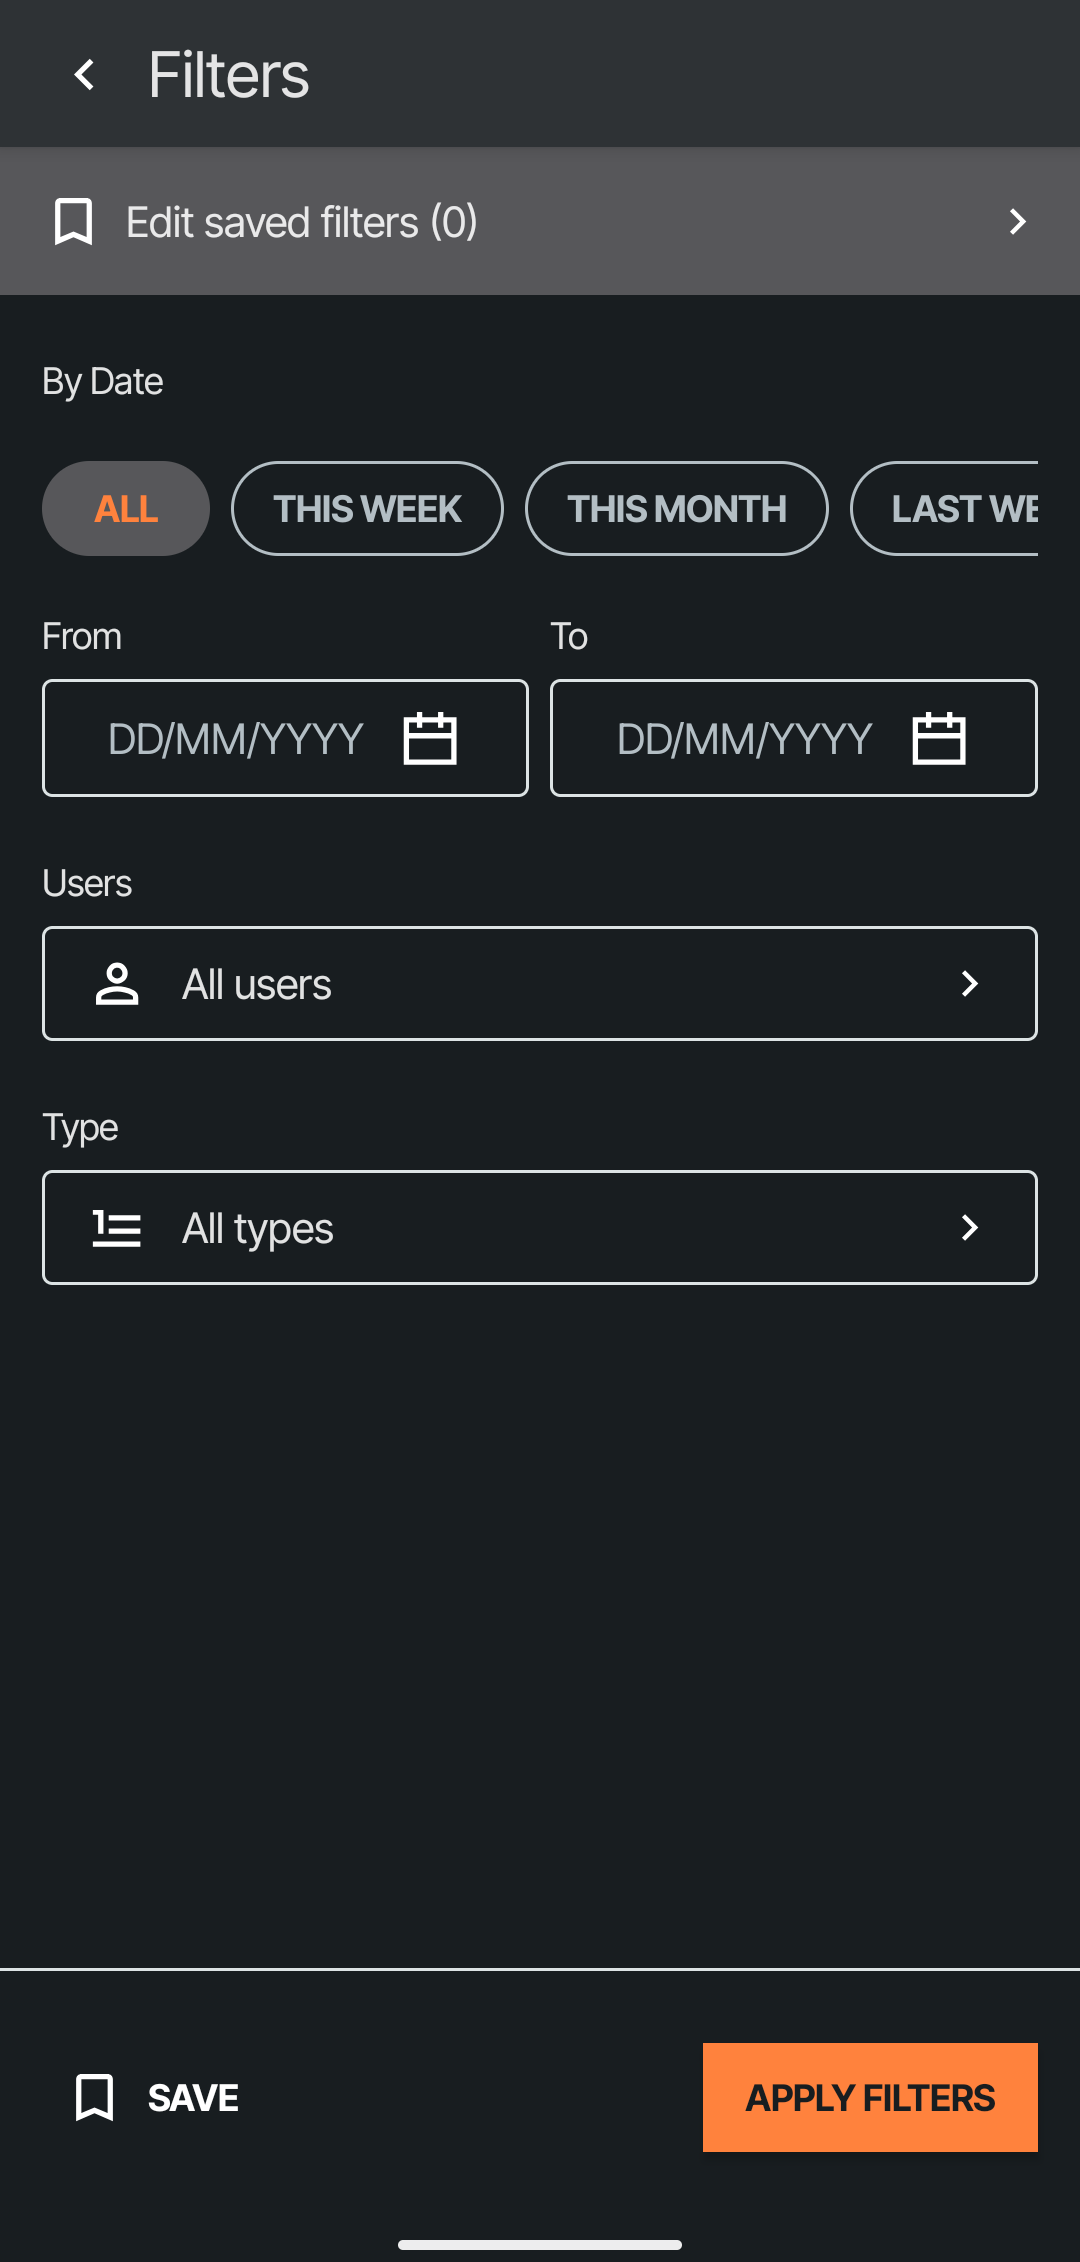
In this menu the user can set options for the filters.
By date | Select a period of dates. |
From | Show photos that are taken after the selected date |
To | Show photos that are taken before the selected date |
Users | Show photos taken or uploaded by selected user or users |
Type | Show photos that have the selected file extensions |
Date filters always use date the photo was taken, not uploaded
After the filters are set, they can be applied by selecting "Apply filters"
By selecting "Save" a new window asking for the filter name will open.
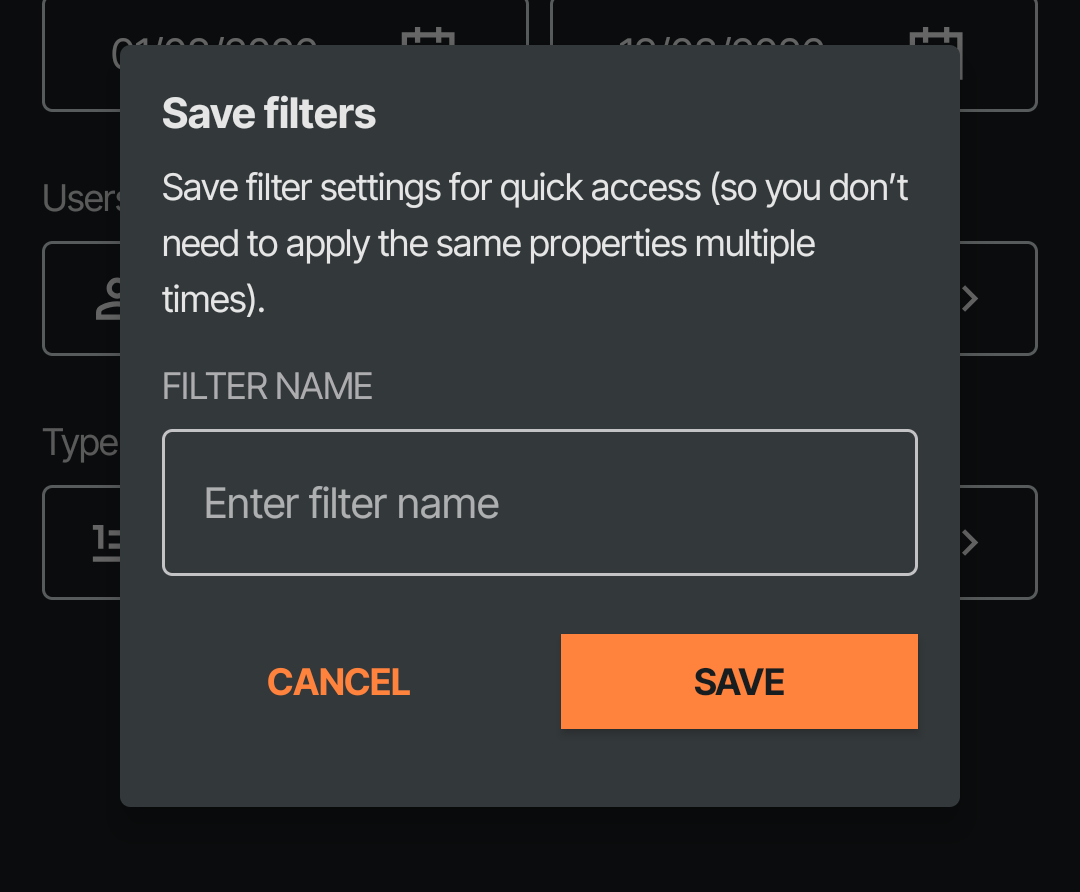
After saving the filter template, it can be edited from the top of the filter menu by accessing the "Edit saved filters" menu.
After saving the template it can be found and applied from the photos menu.
Opening photos
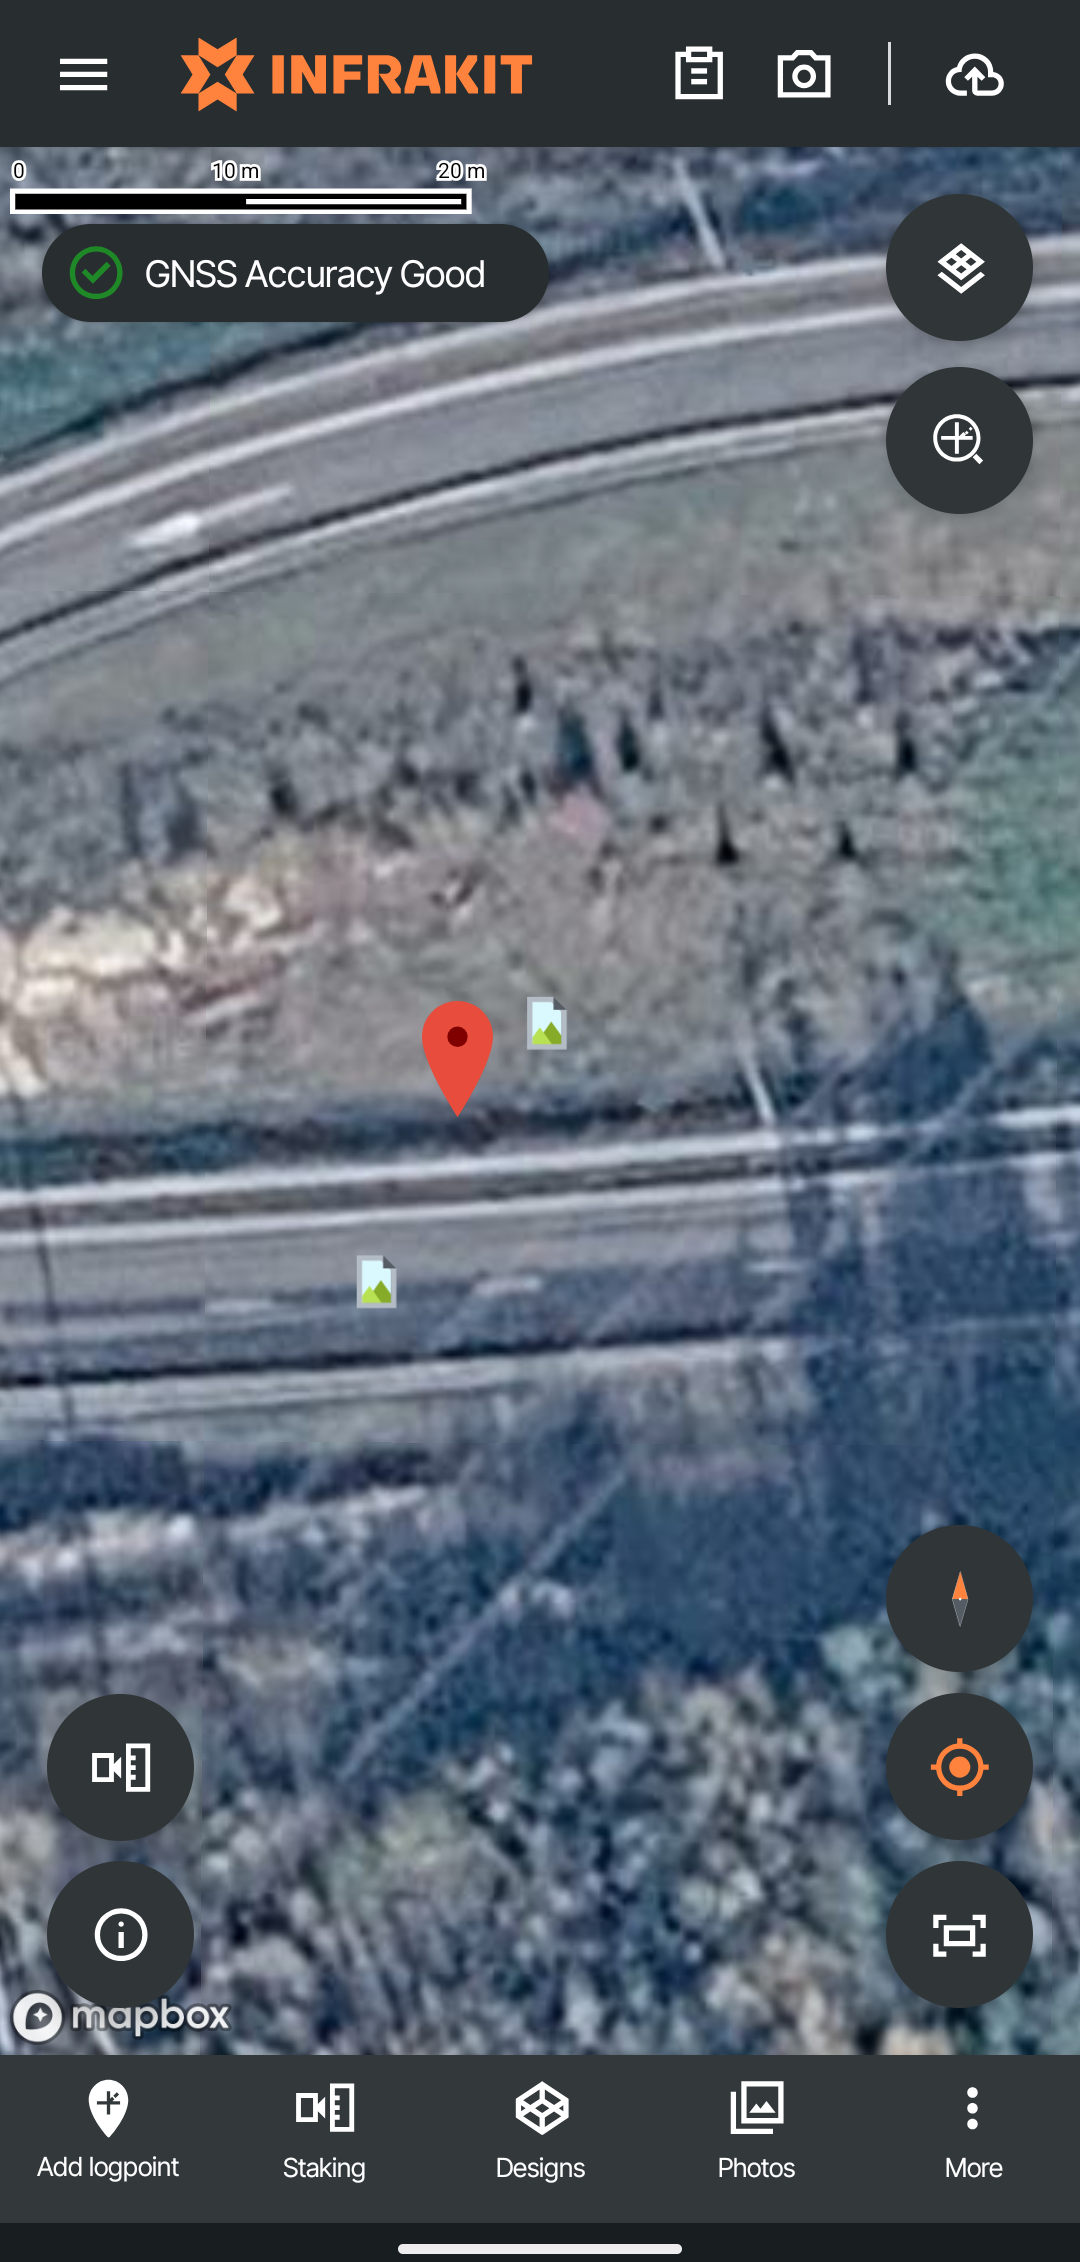
After activating the photo on the map, it can be opened by tapping on it's icon.
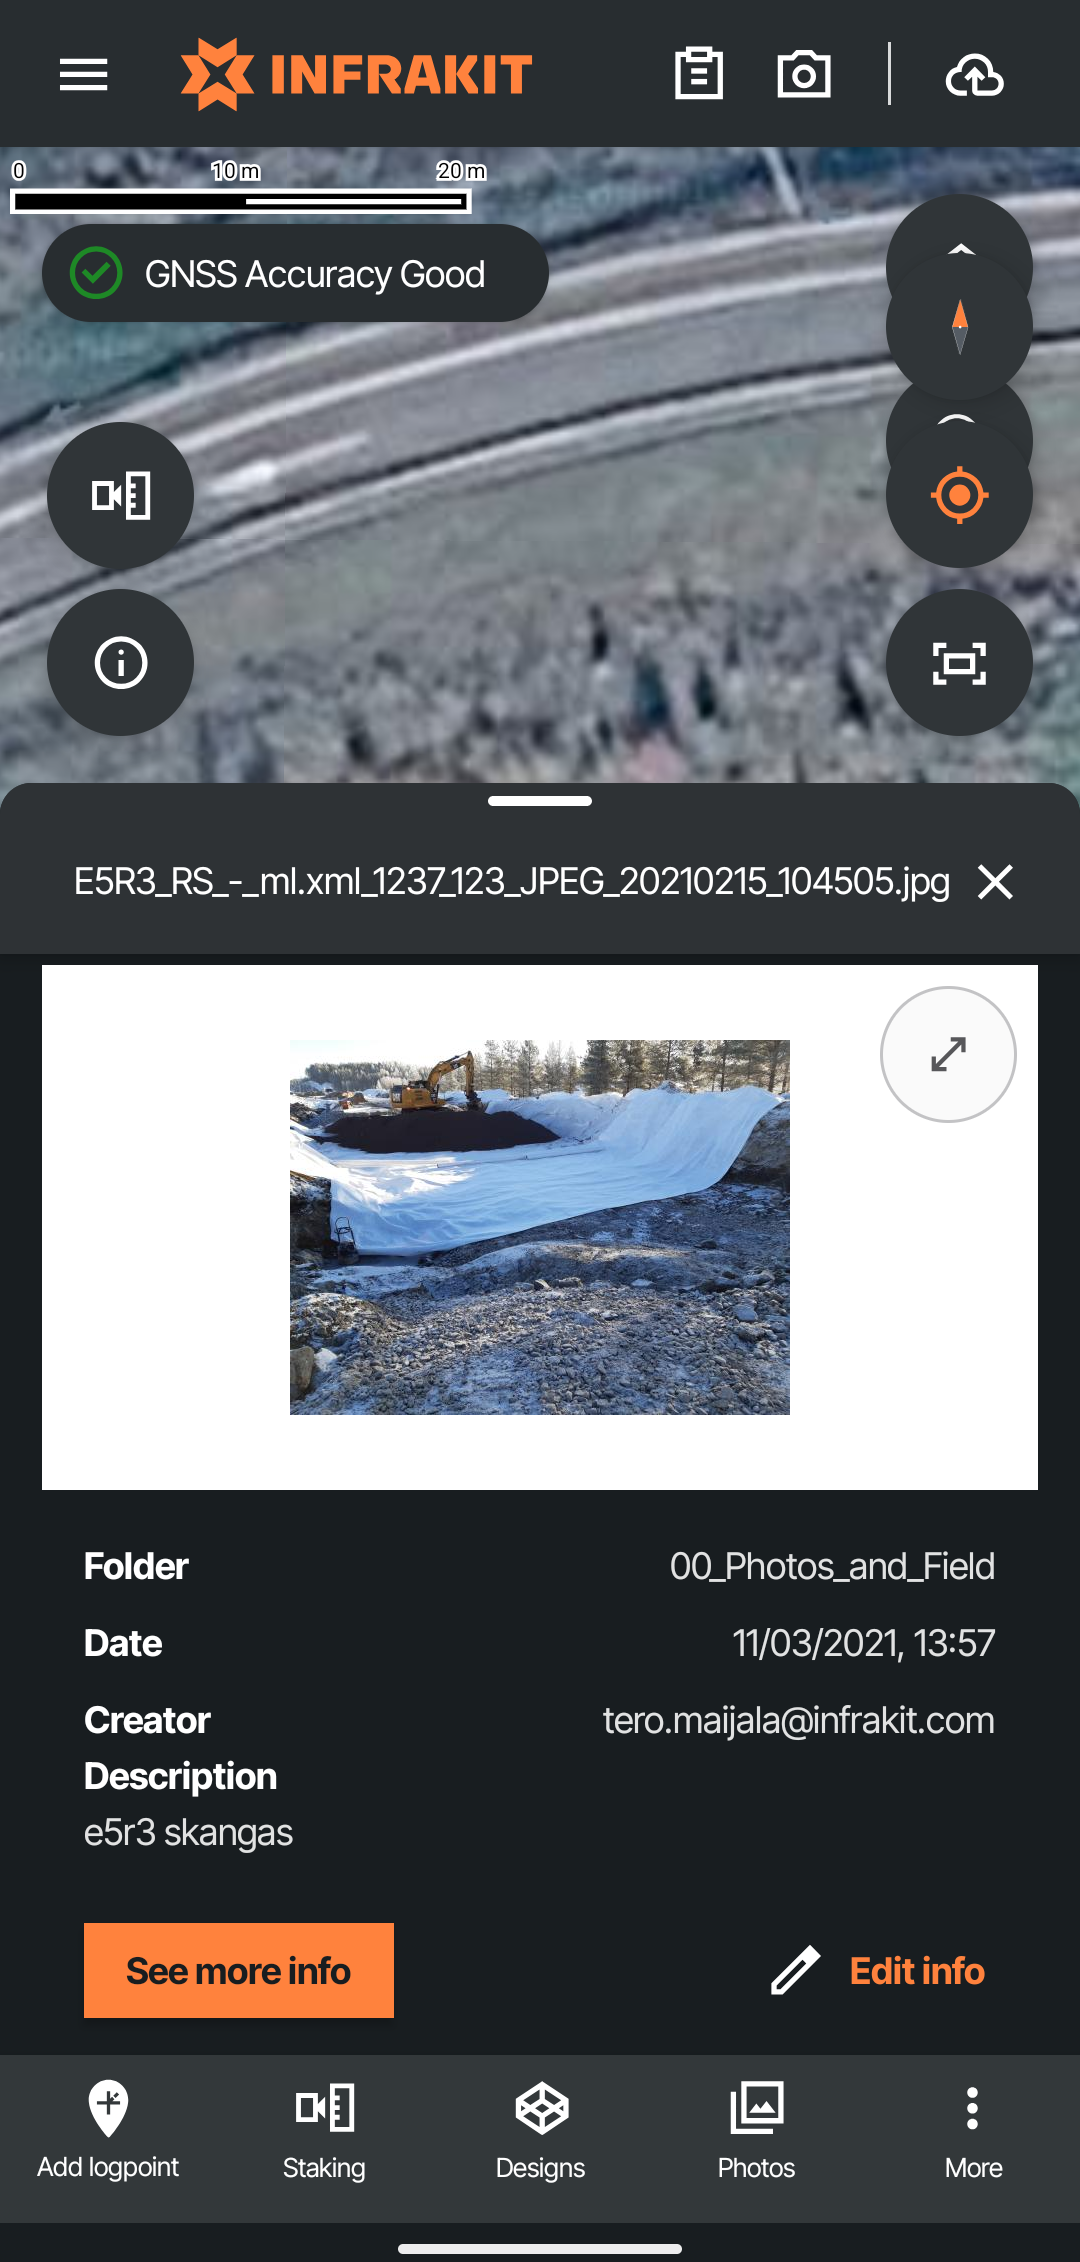
If a file is activated in the menu, the application will automatically jump to its' location. To see info about the photo the user can click on the three dots and selecting "More info"
As-built
From the as built menu the user can activate and view logpoints saved to the project.
As-built menu
As-built menu has the same navigation options as the designs menu.
Activating a folder in the menu will visualize all logpoints that are saved there.
Logpoints attached to a file can be visualized on the map by activating the file in the menu.
Logpoints on the map screen
After visualizing logpoints on a map the user has a few options to interact with them by tapping on a logpoint.
After selecting a point, it can be used as a target in stake-out mode by tapping "Navigate to point" button
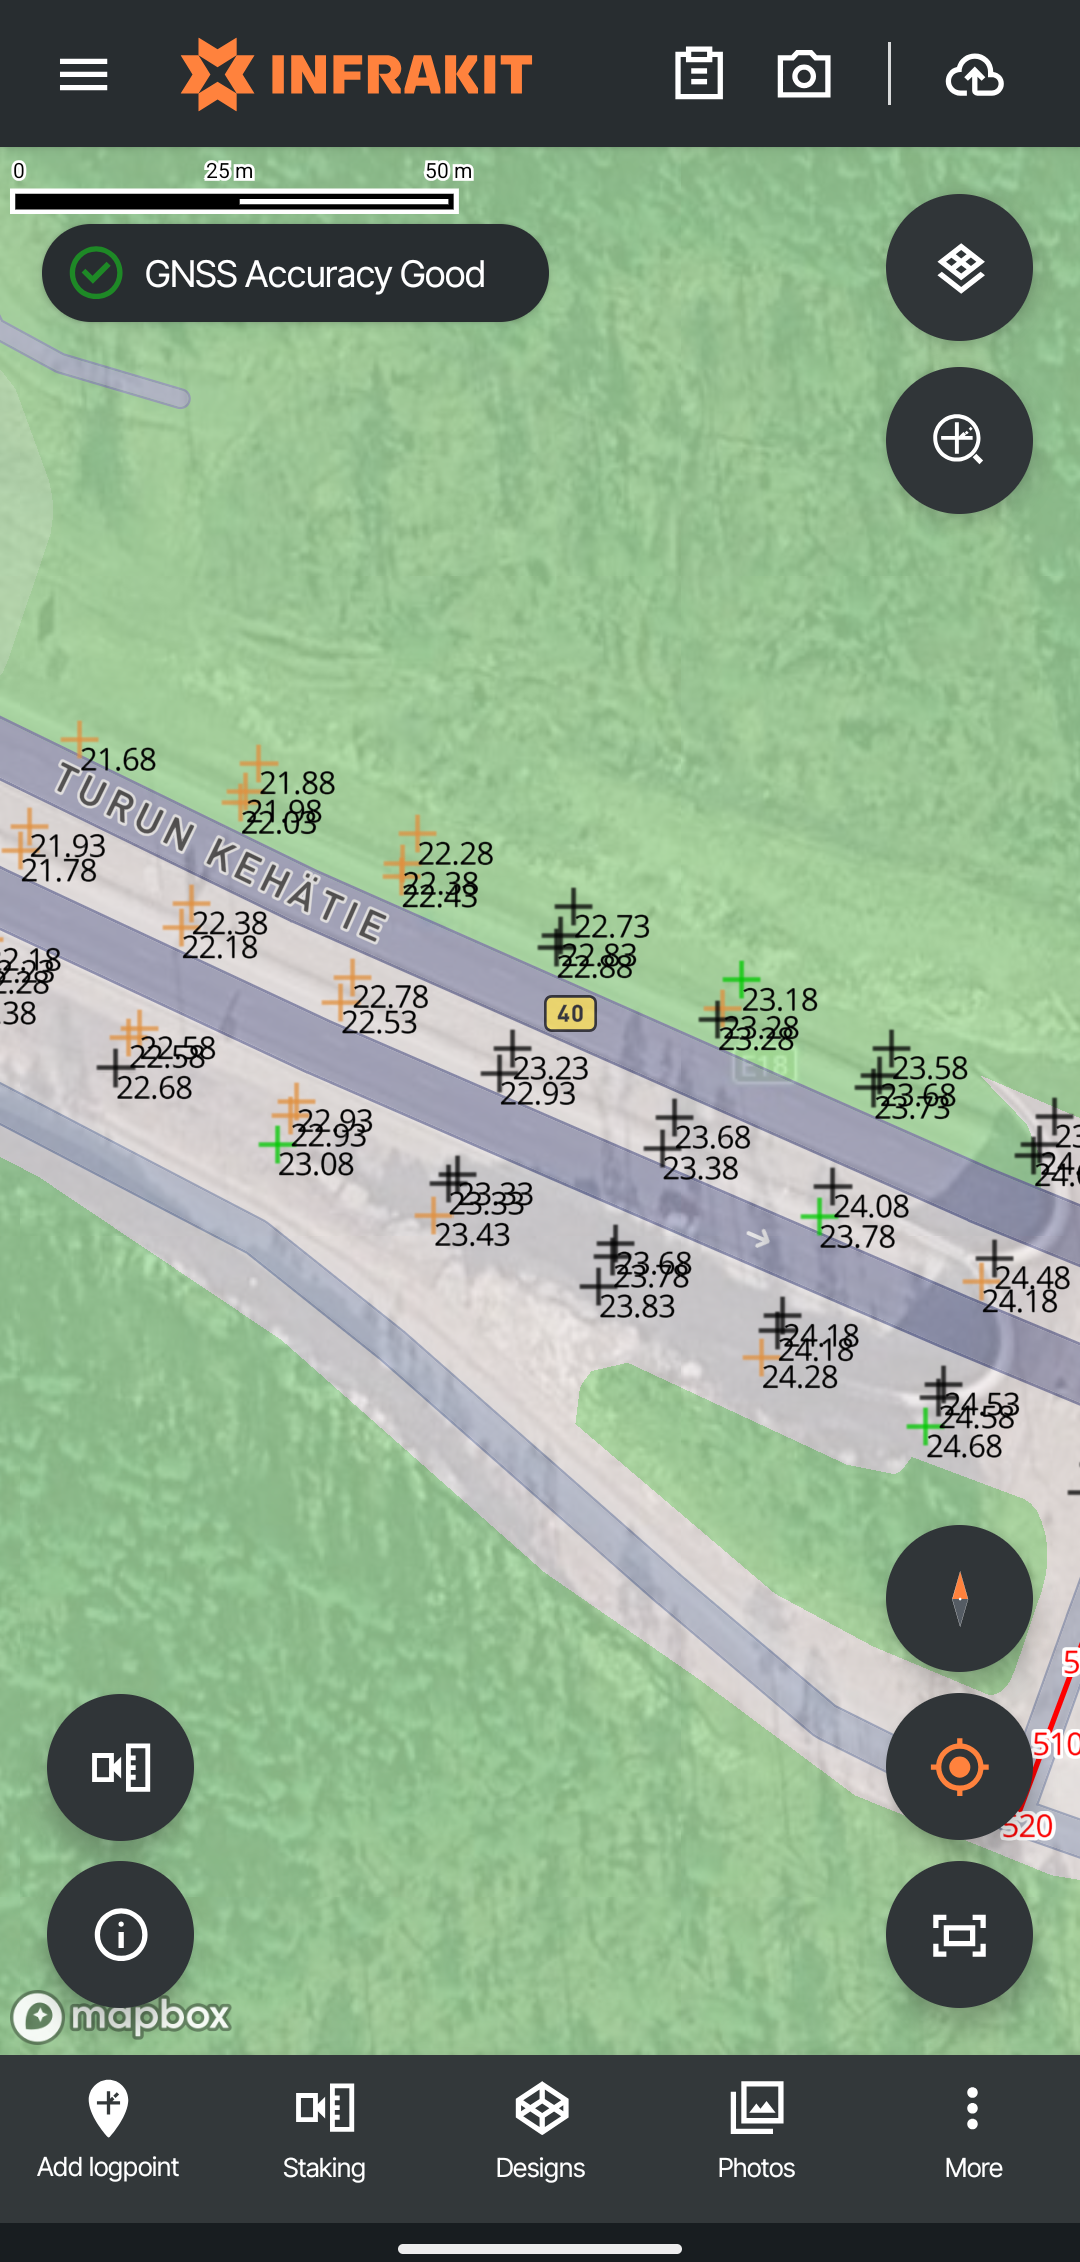
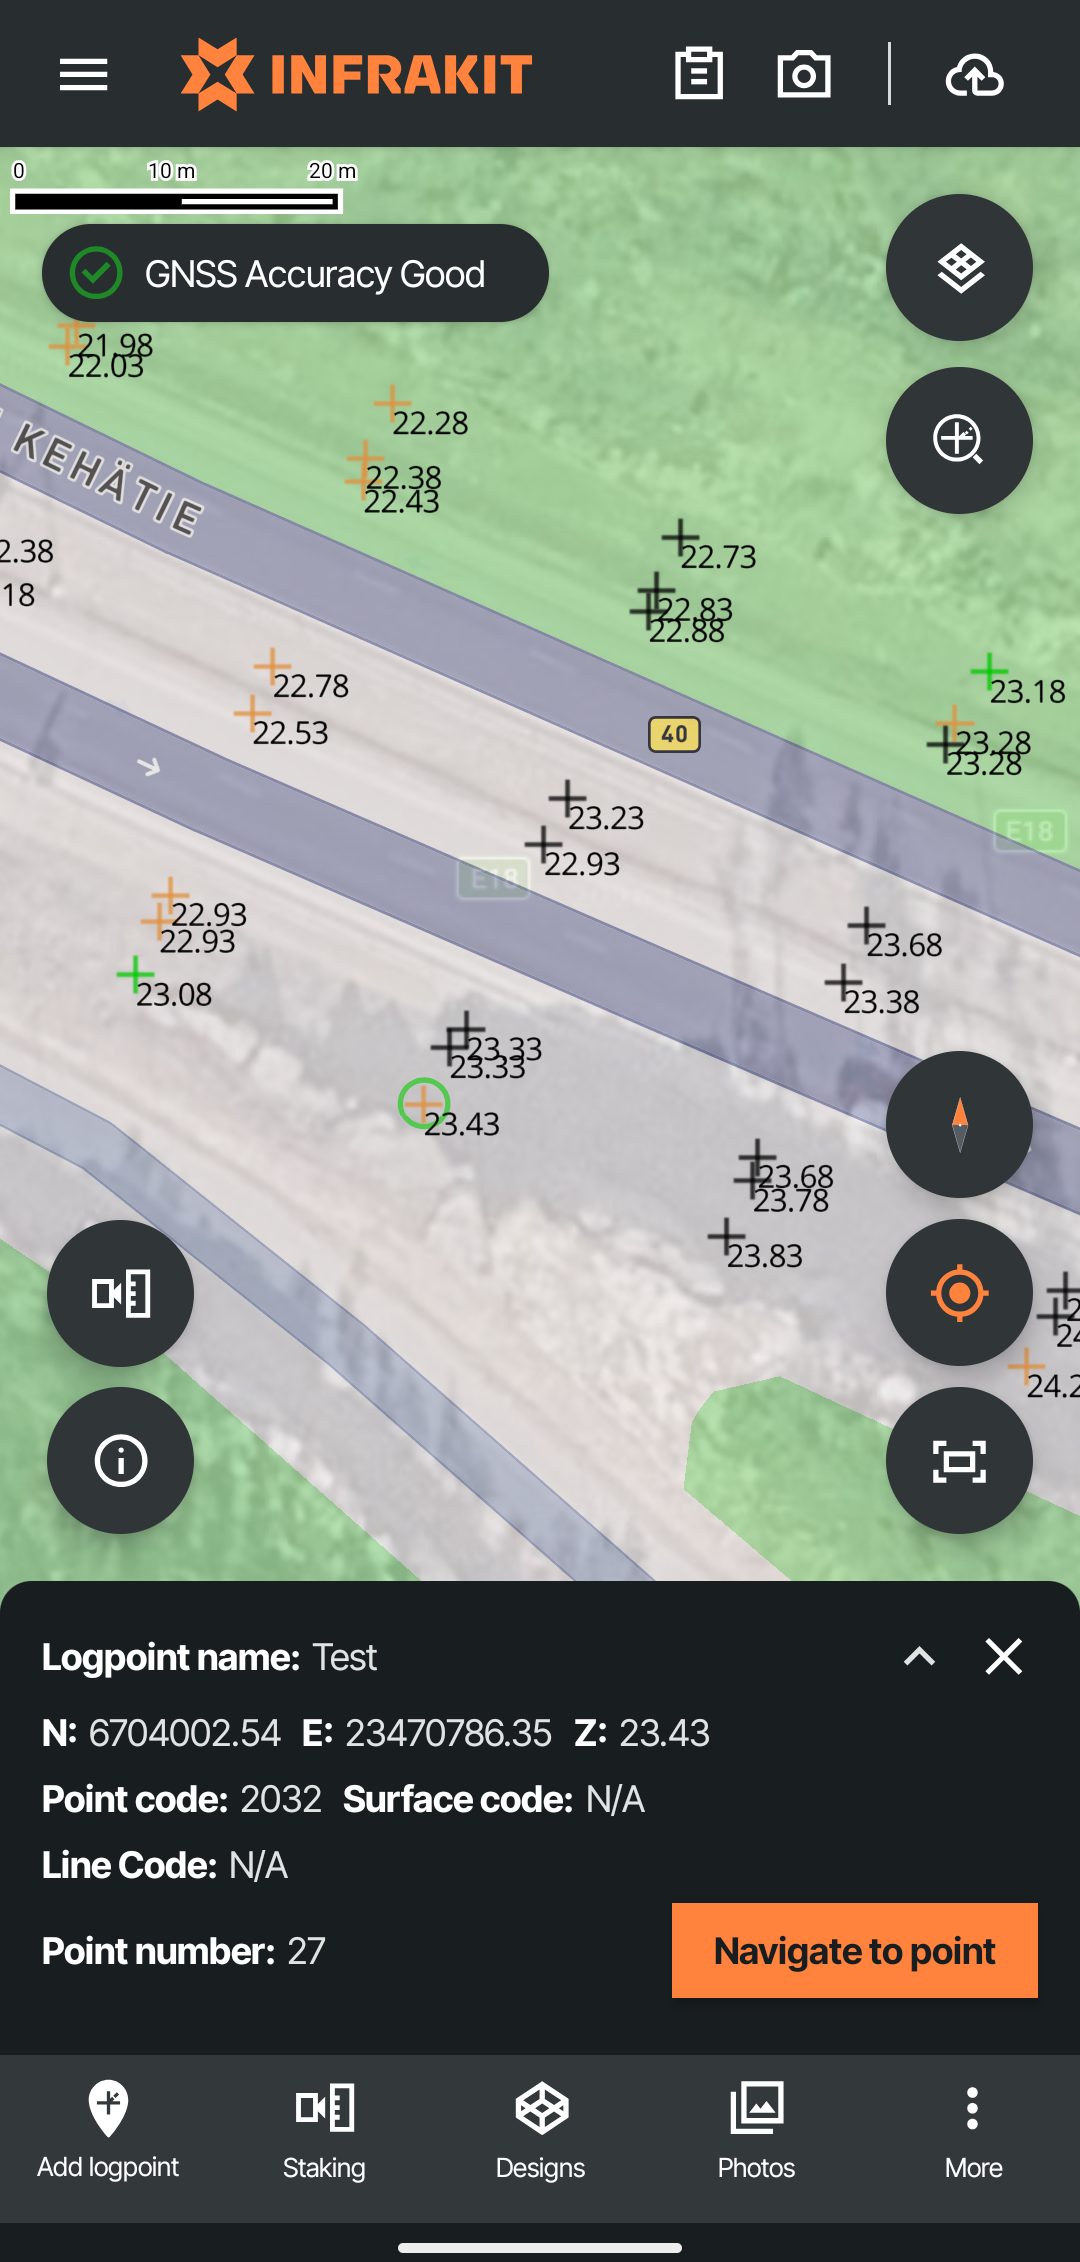
The logpoints automatically show if the point is in tolerance, their status and the height of the logpoint
By tapping on a logpoint its' basic info is shown.
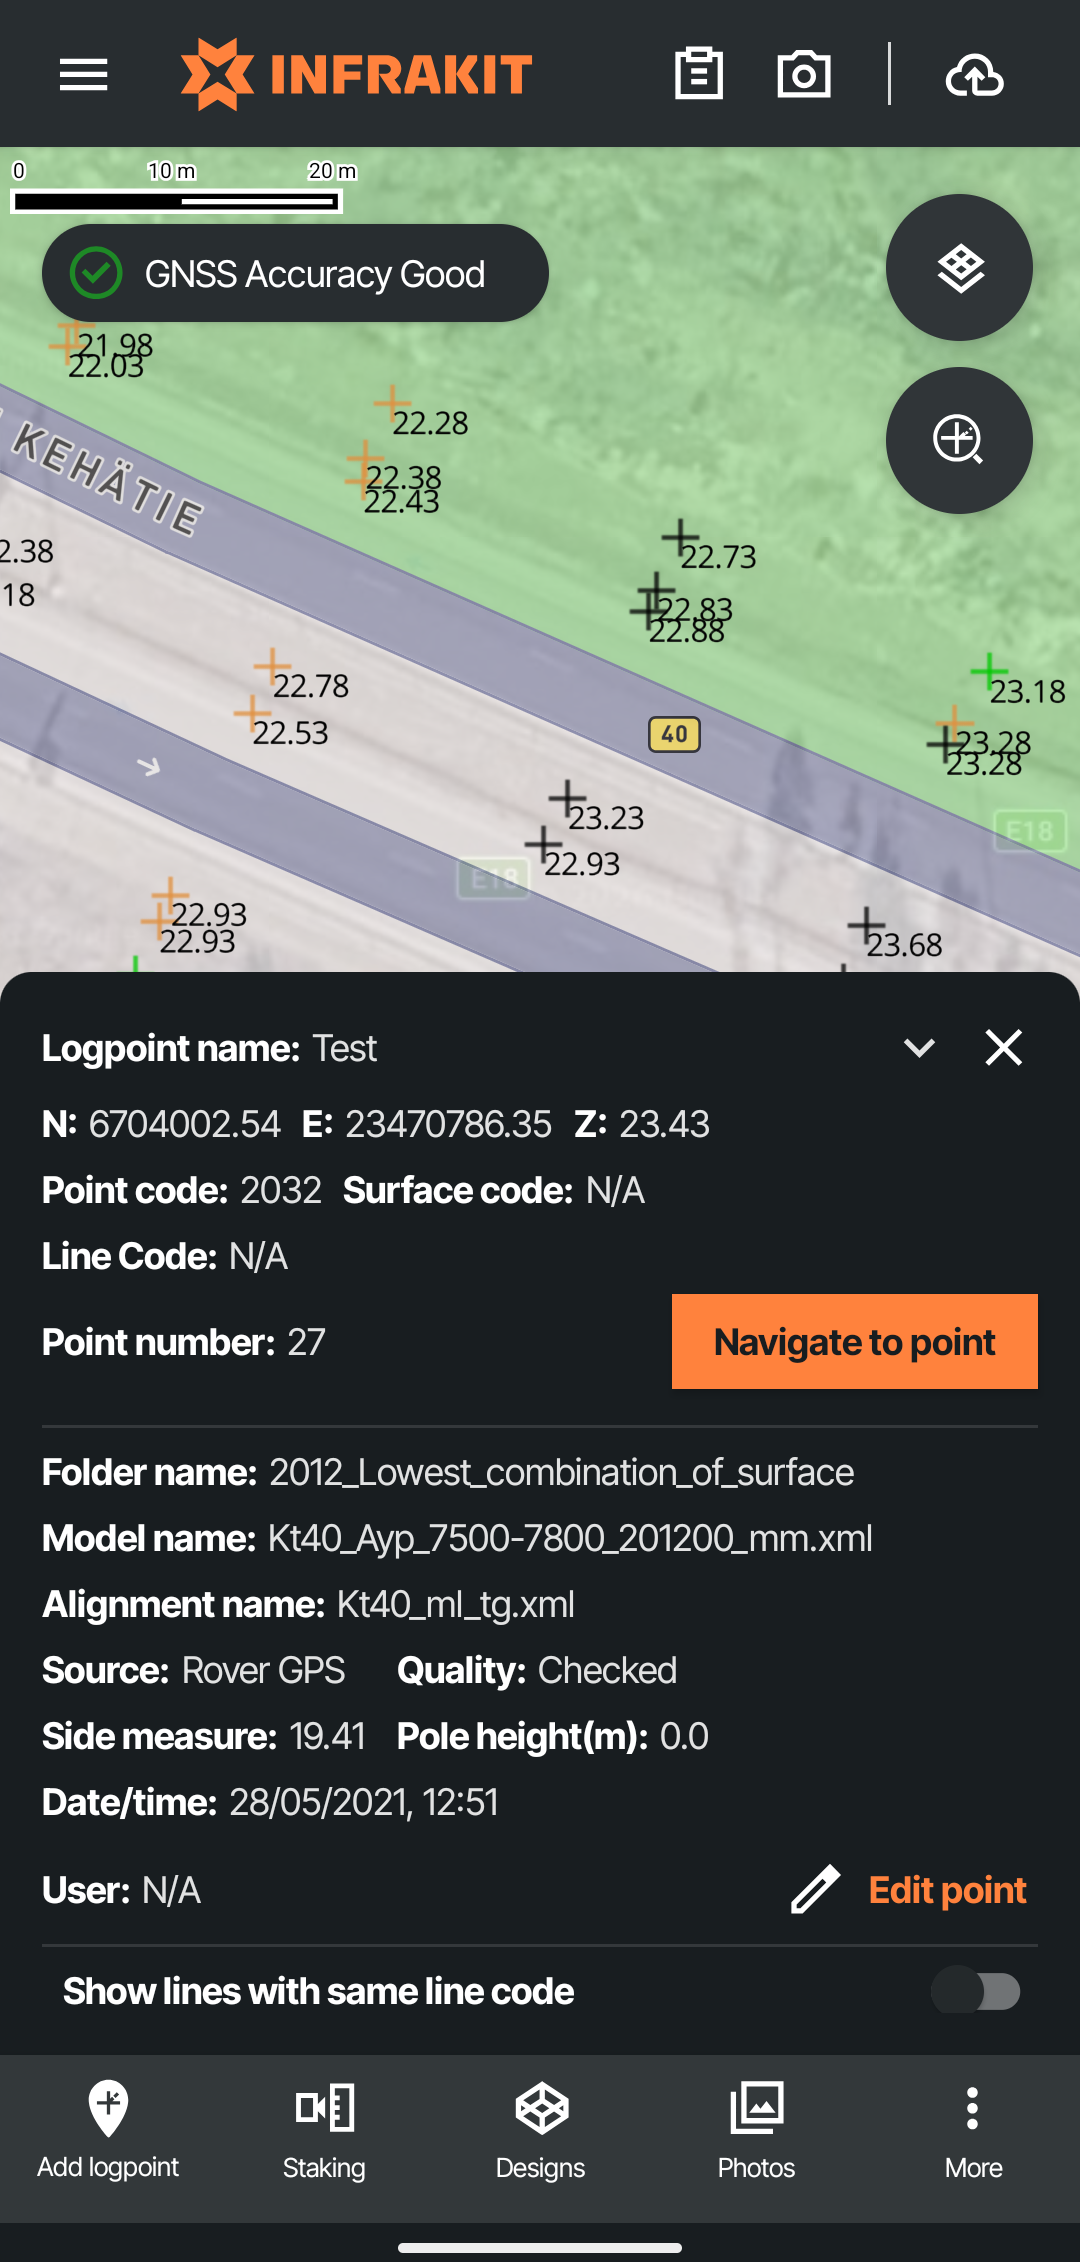
More info about the logpoint and the ability to edit it can be accessed by tapping the up arrow on the top of the logpoint window
Logpoint filters
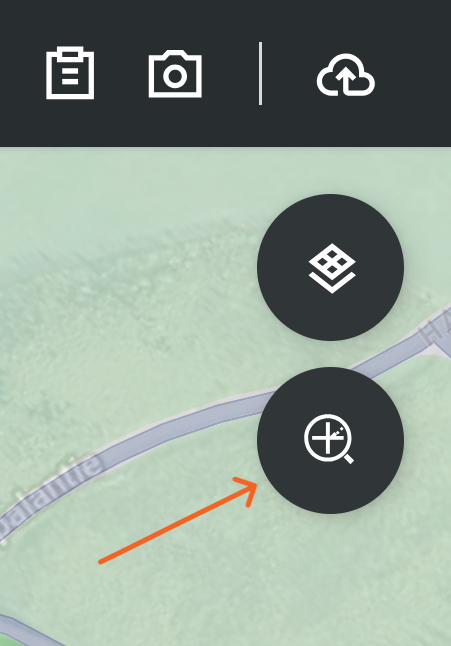
After activating some logpoints from the toolbar menu, a new icon appears on the map that allows the user to search and filter points.
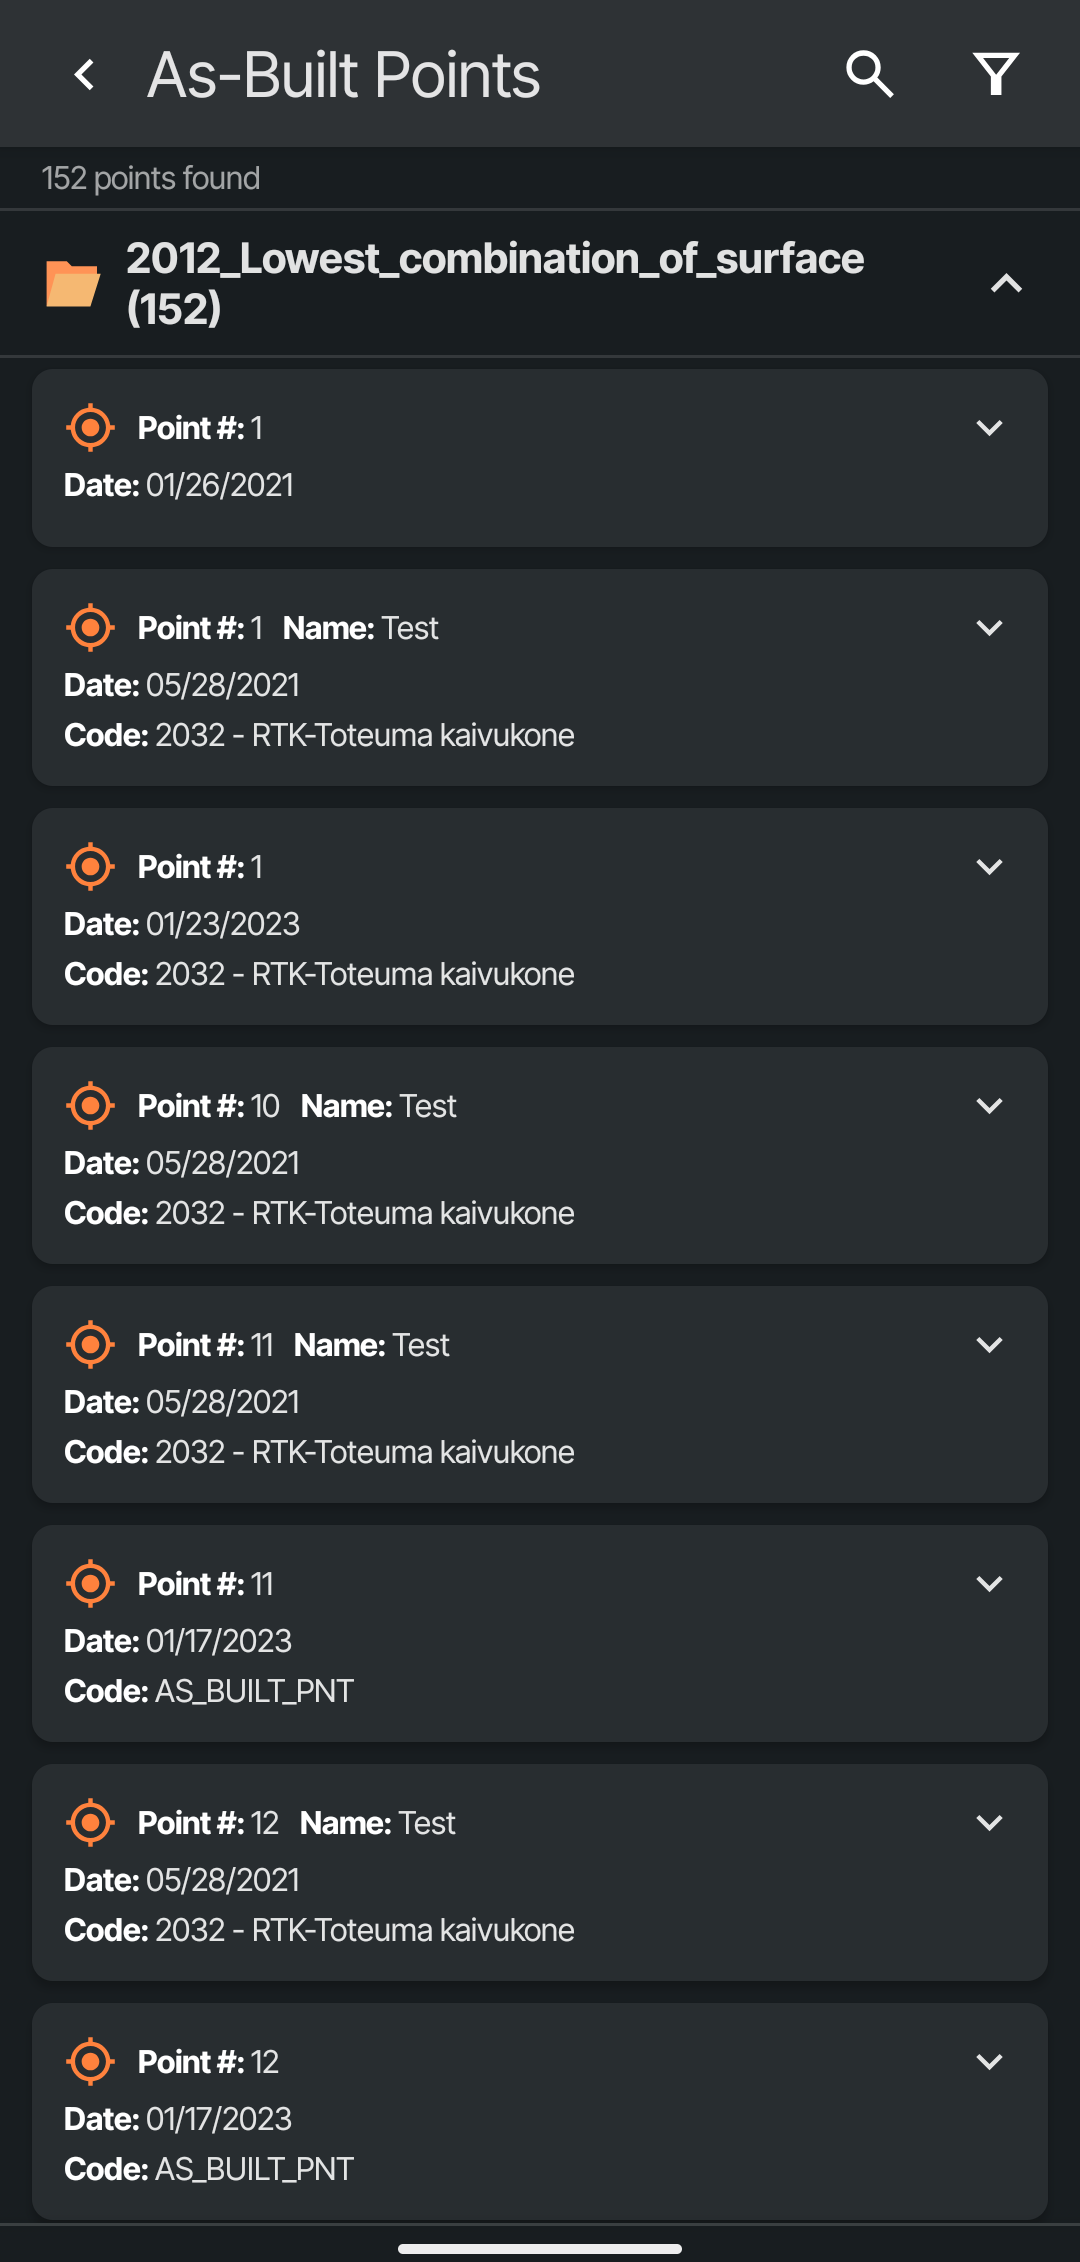
The menu shows info from the logpoints. Only activated points are shown in this menu. Tapping on a point shows more info about the point.
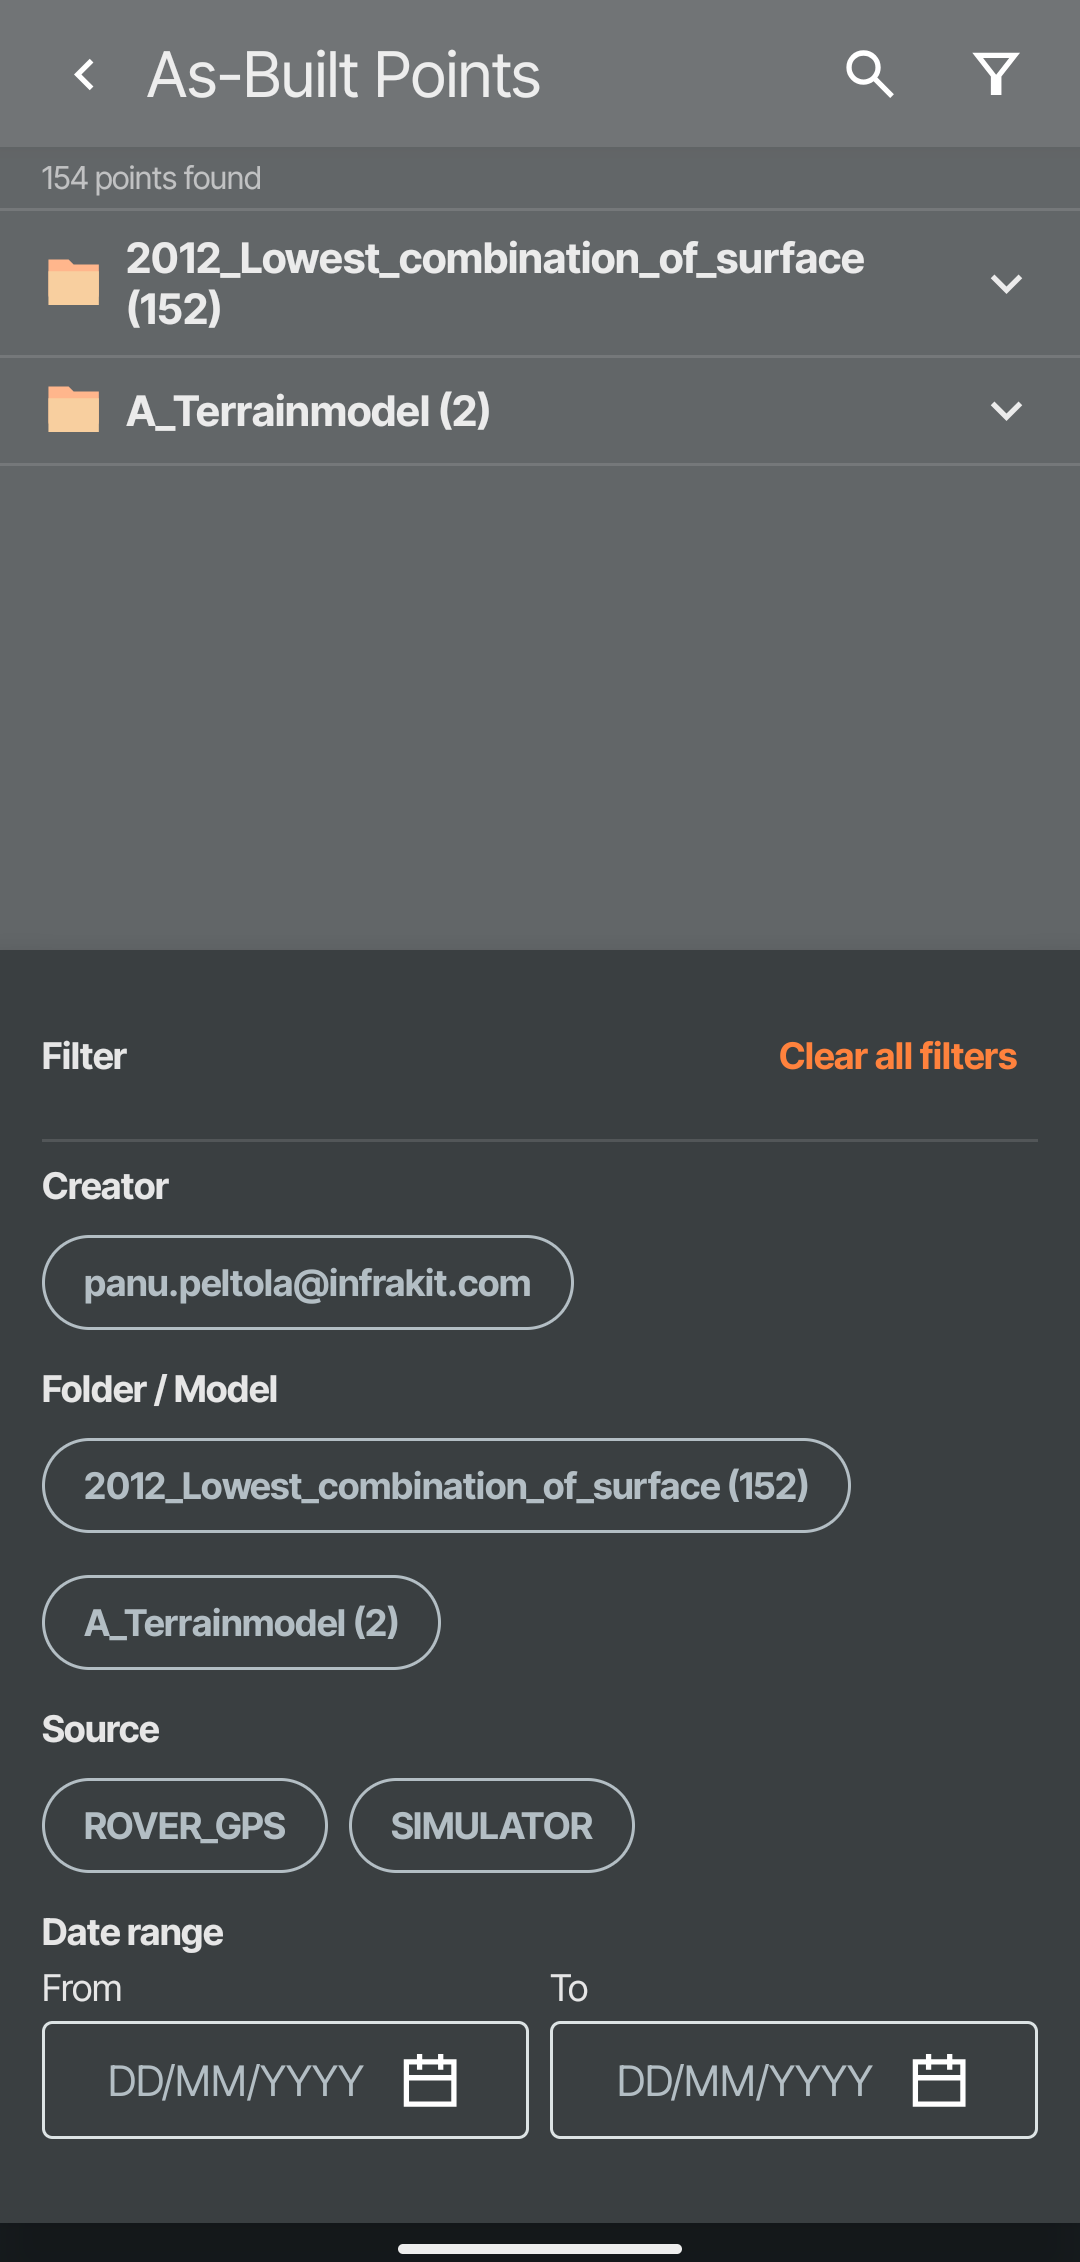
As-Built points menu allows the user to filter by creator, folder/model, source and date range.
If only logpoints taken by machine control systems are selected, no creator filter is shown.
Edit logpoint
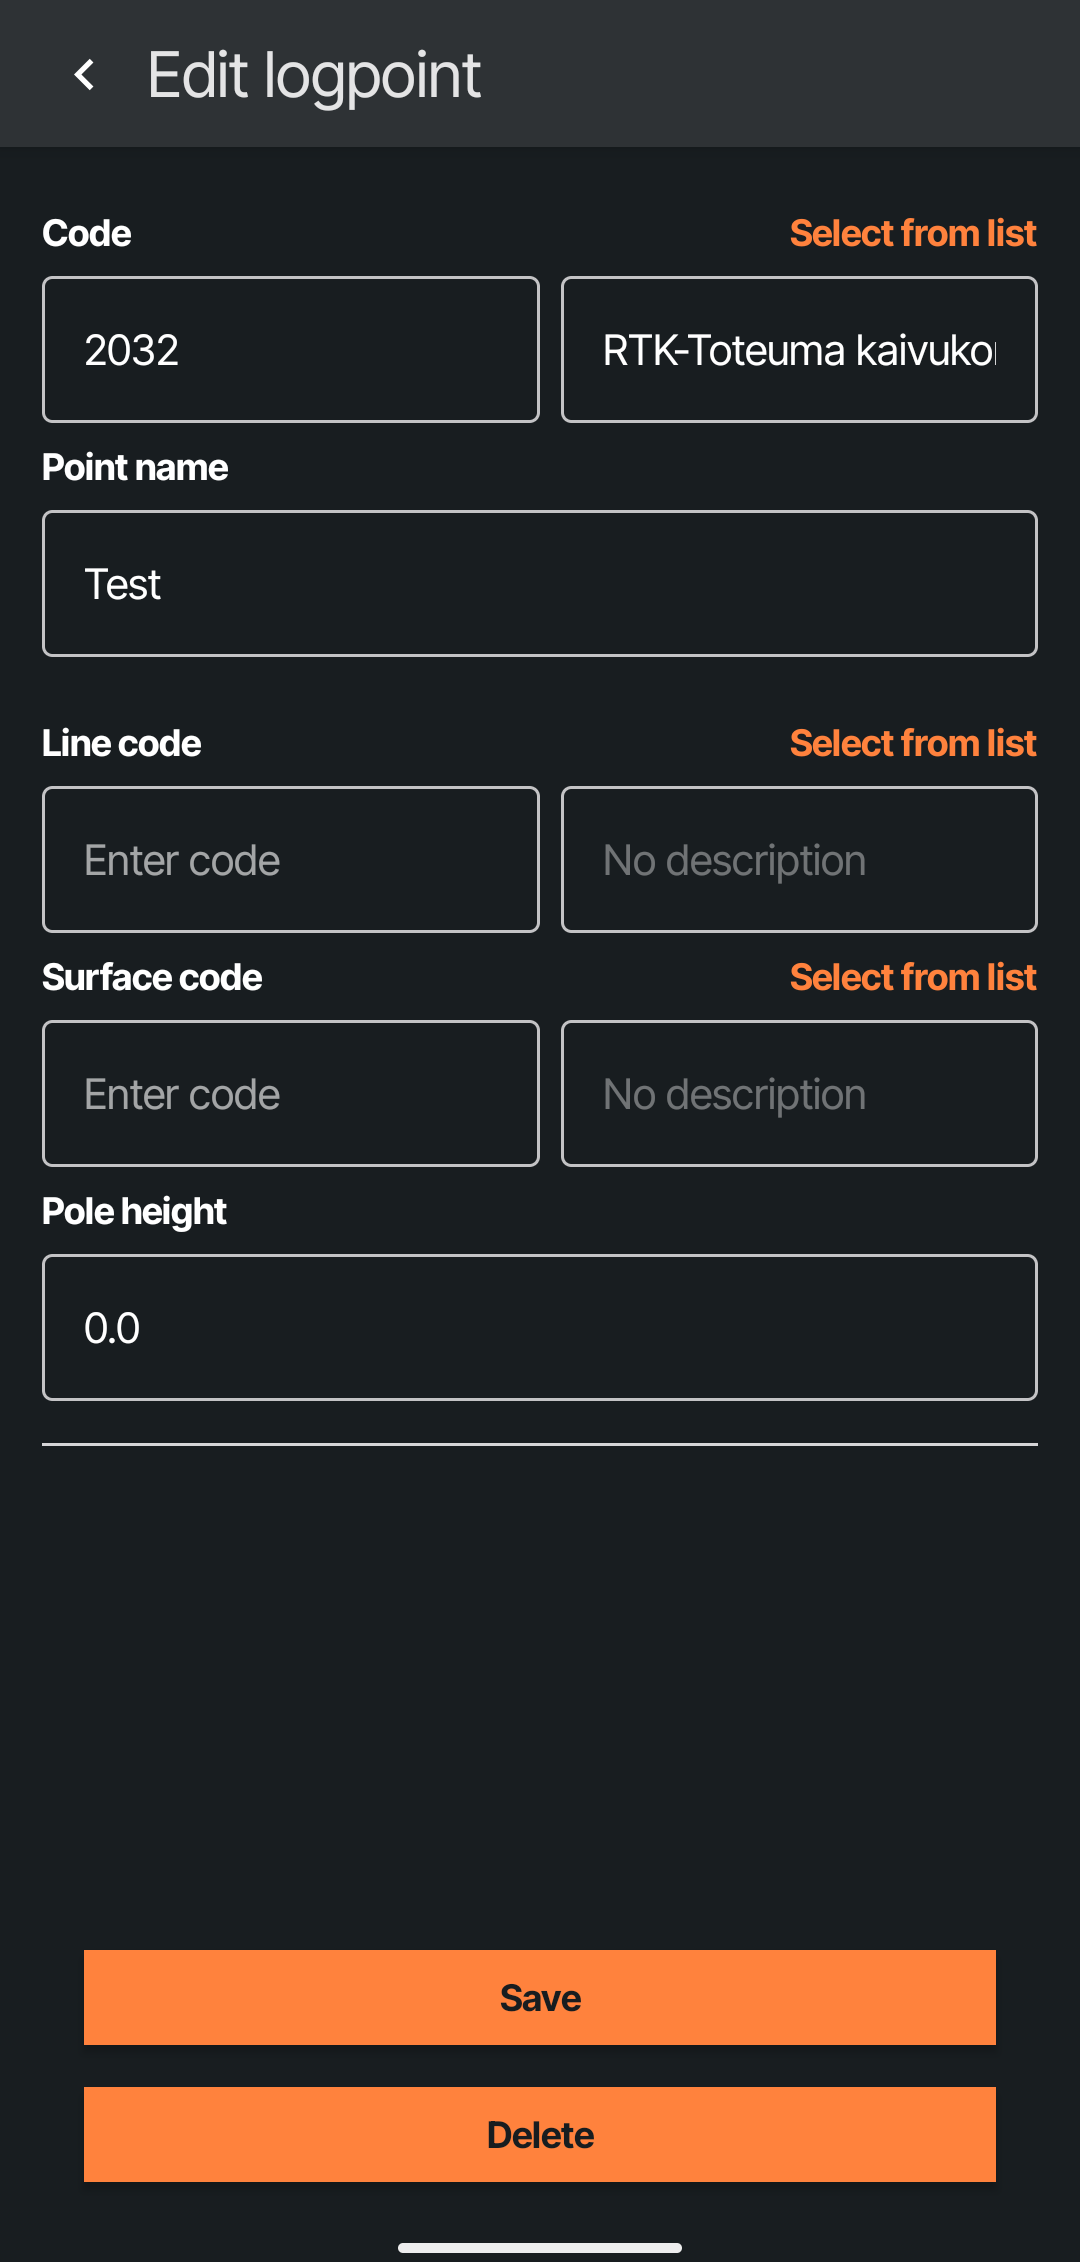
From the edit logpoint menu the user can:
Edit codes of the logpoint. Codes can be selected from a list if codelist is set to the Infrakit project.
Edit point name
Edit pole height
Save changes
Delete the logpoint
Codelist can be activated by uploading a .nfcl file to the project and setting it as codelist in the project settings. This can only be done inside Infrakit Office browser software.
Equipment
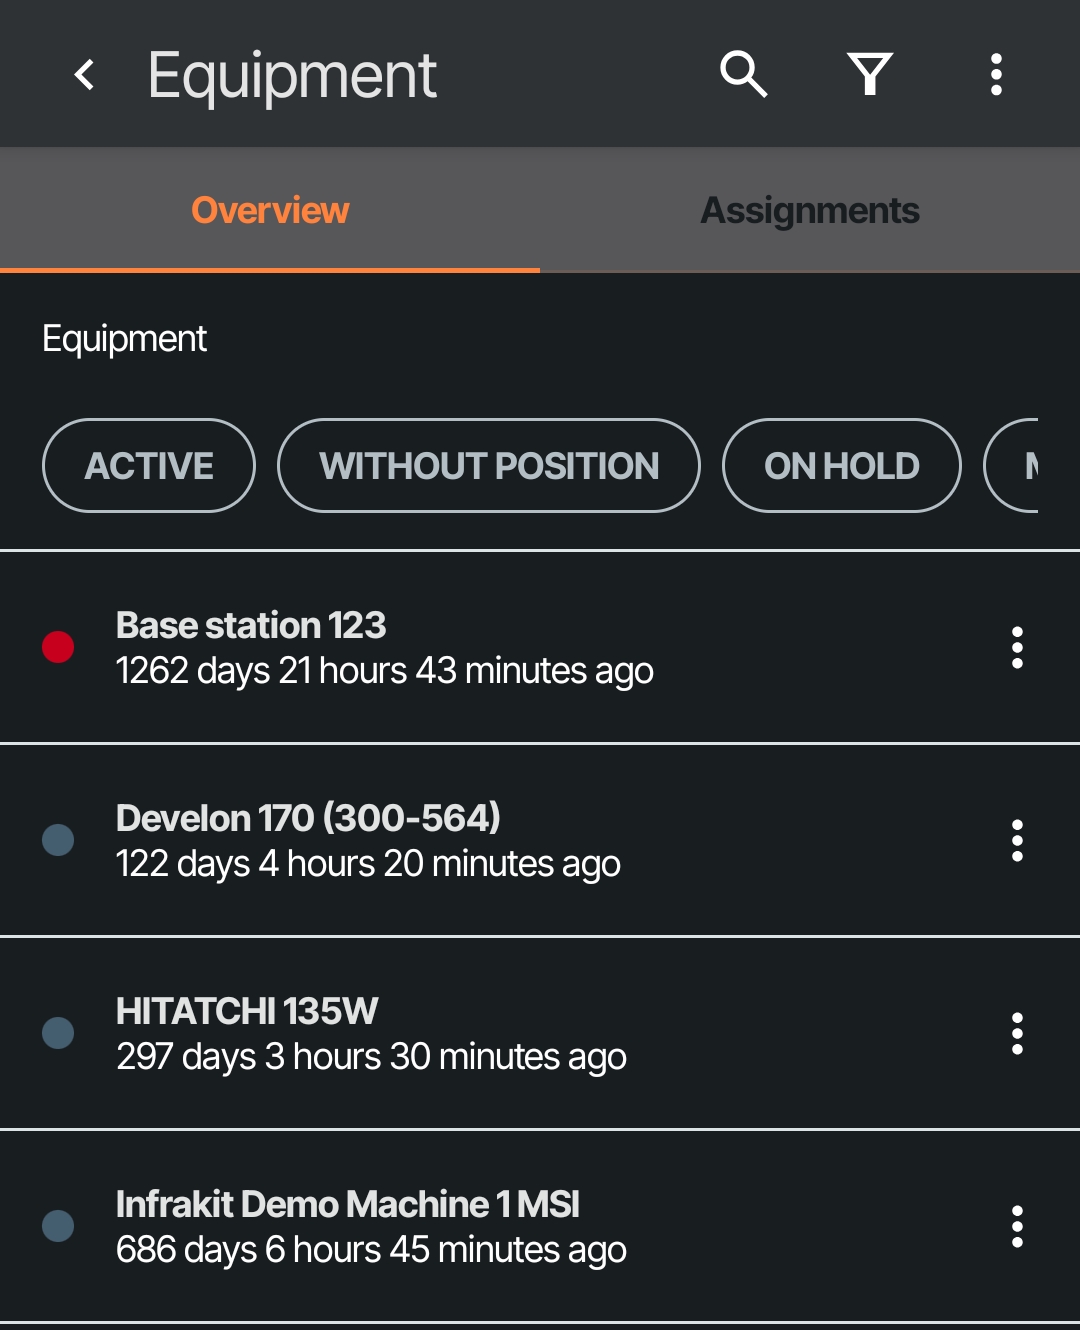
Equipment screen shows equipment added to the project and their status.
Overview
Overview shows the current status of machines on project. Equipment can be filtered by using the activity status of the equipment.
More info from the equipment can be found by tapping on the three dots next to the name of the equipment. The map can also be centered to equipment from that menu.
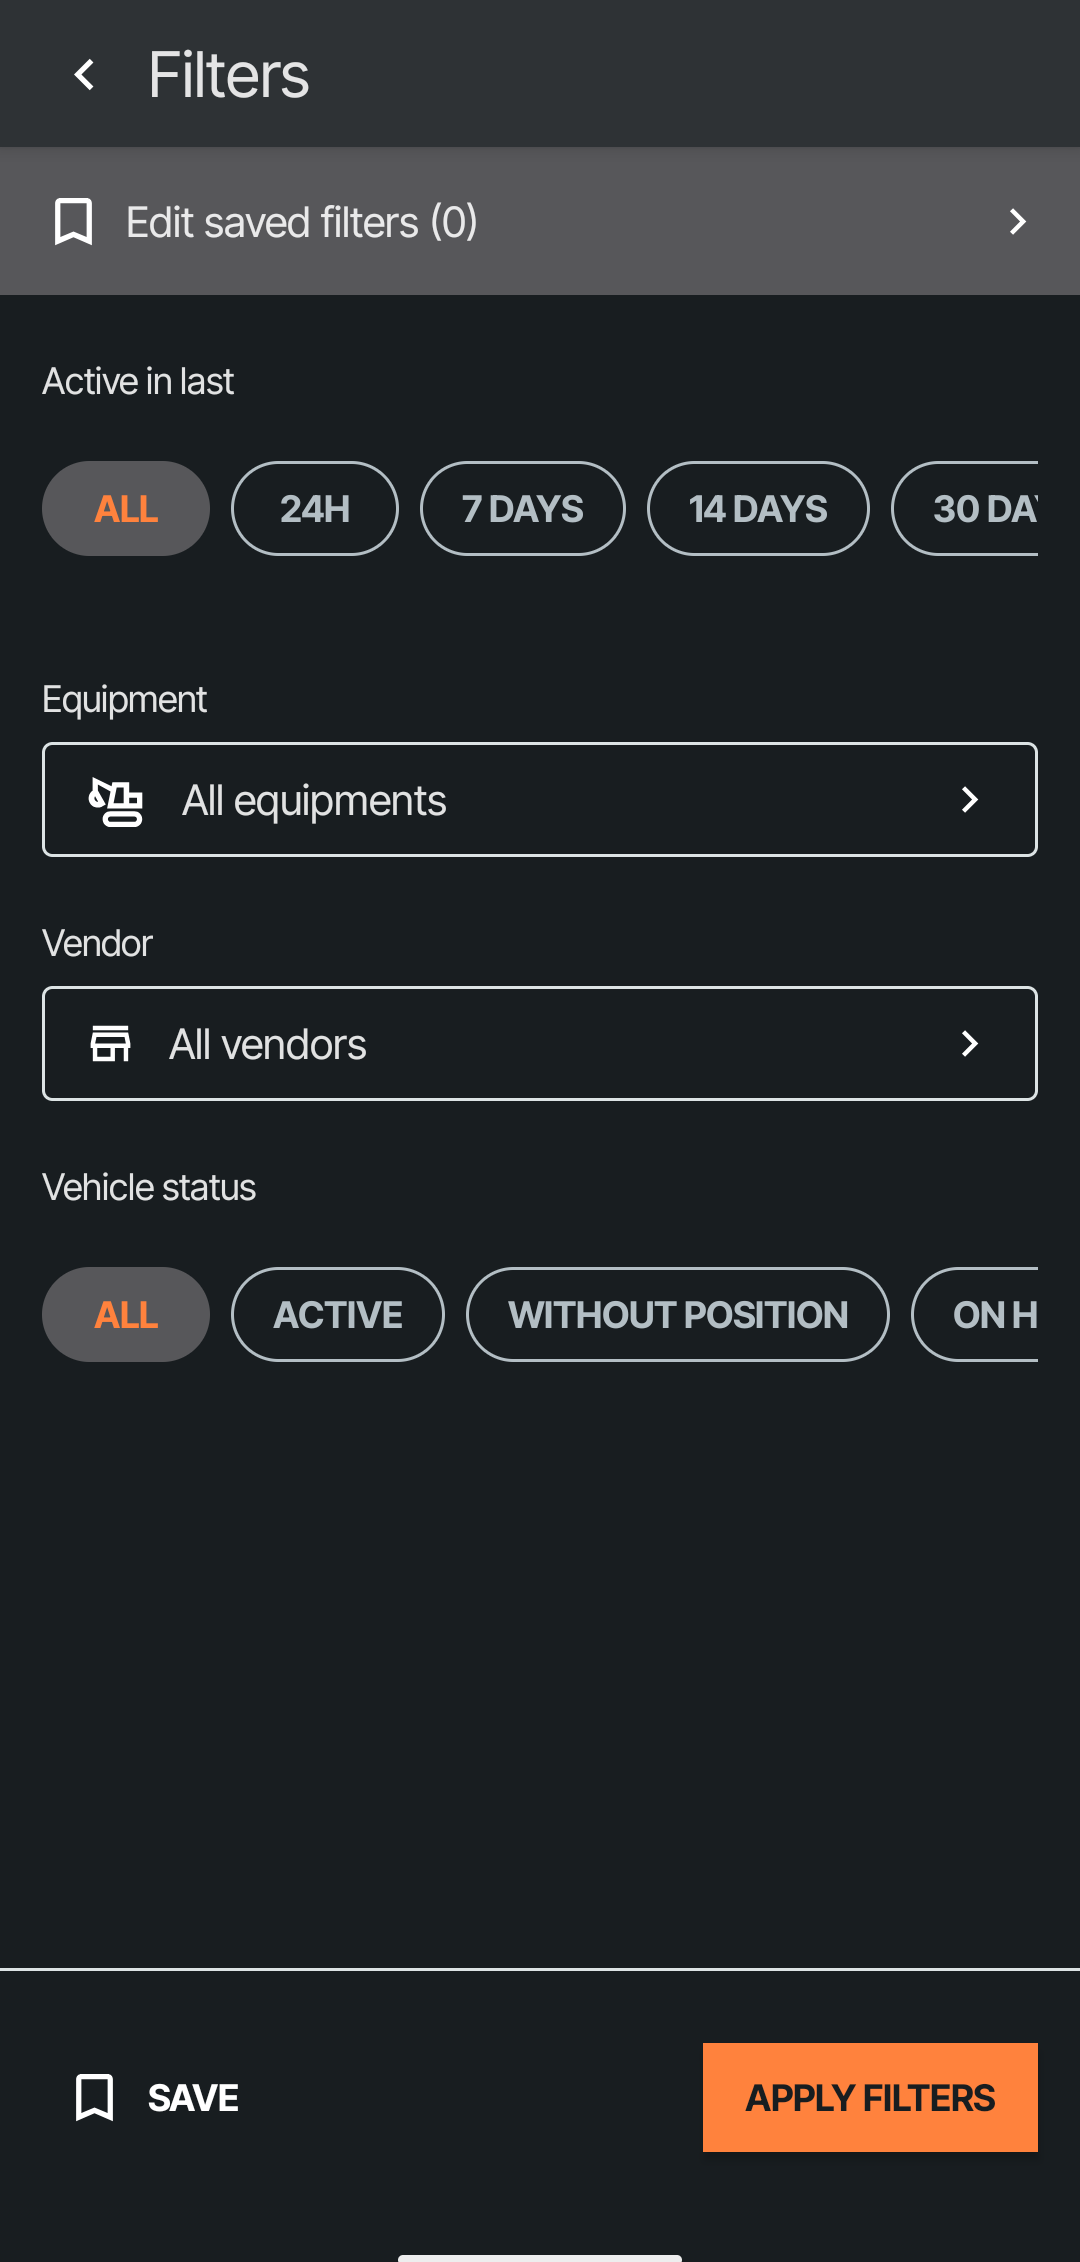
More filters can be created by tapping on the syphon button and creating new filter sets. They can be saved the same way as photo filters.
Assignments
Assignments show the list of assignments on the project.
At the moment only the names are listed
Add logpoint
By selecting the add logpoint feature the user can survey new logpoints that are automatically uploaded to Infrakit project.
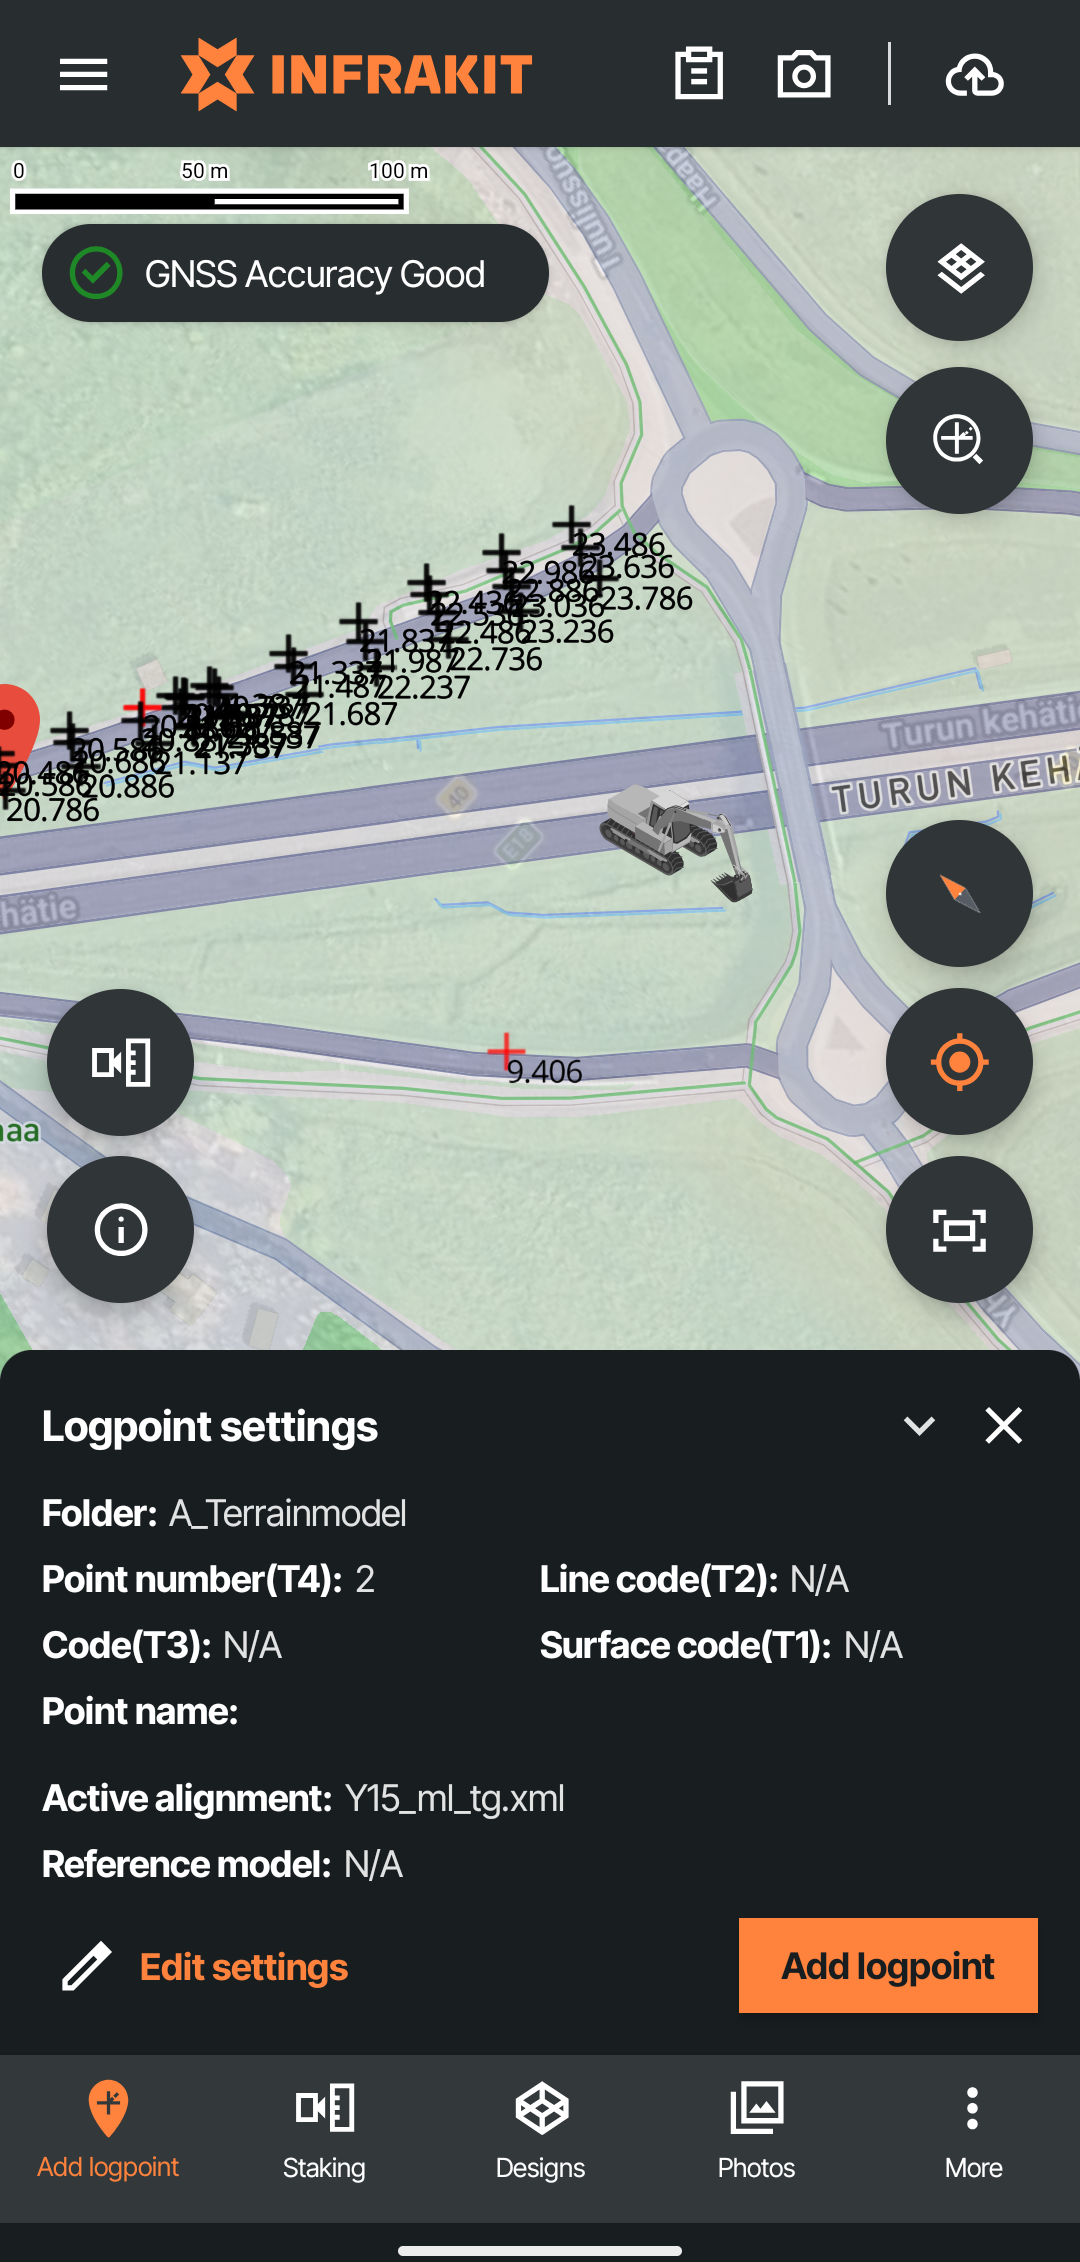
After selecting the "Add logpoint" feature the user can see current settings for the logpoint. A new logpoint can be taken with these settings by selecting "Add logpoint" or they can be edited by selecting "Edit settings" The settings are shown below.
After changing the settings and confirming everything is correct a new logpoint can be saved by tapping the "Add logpoint" button.
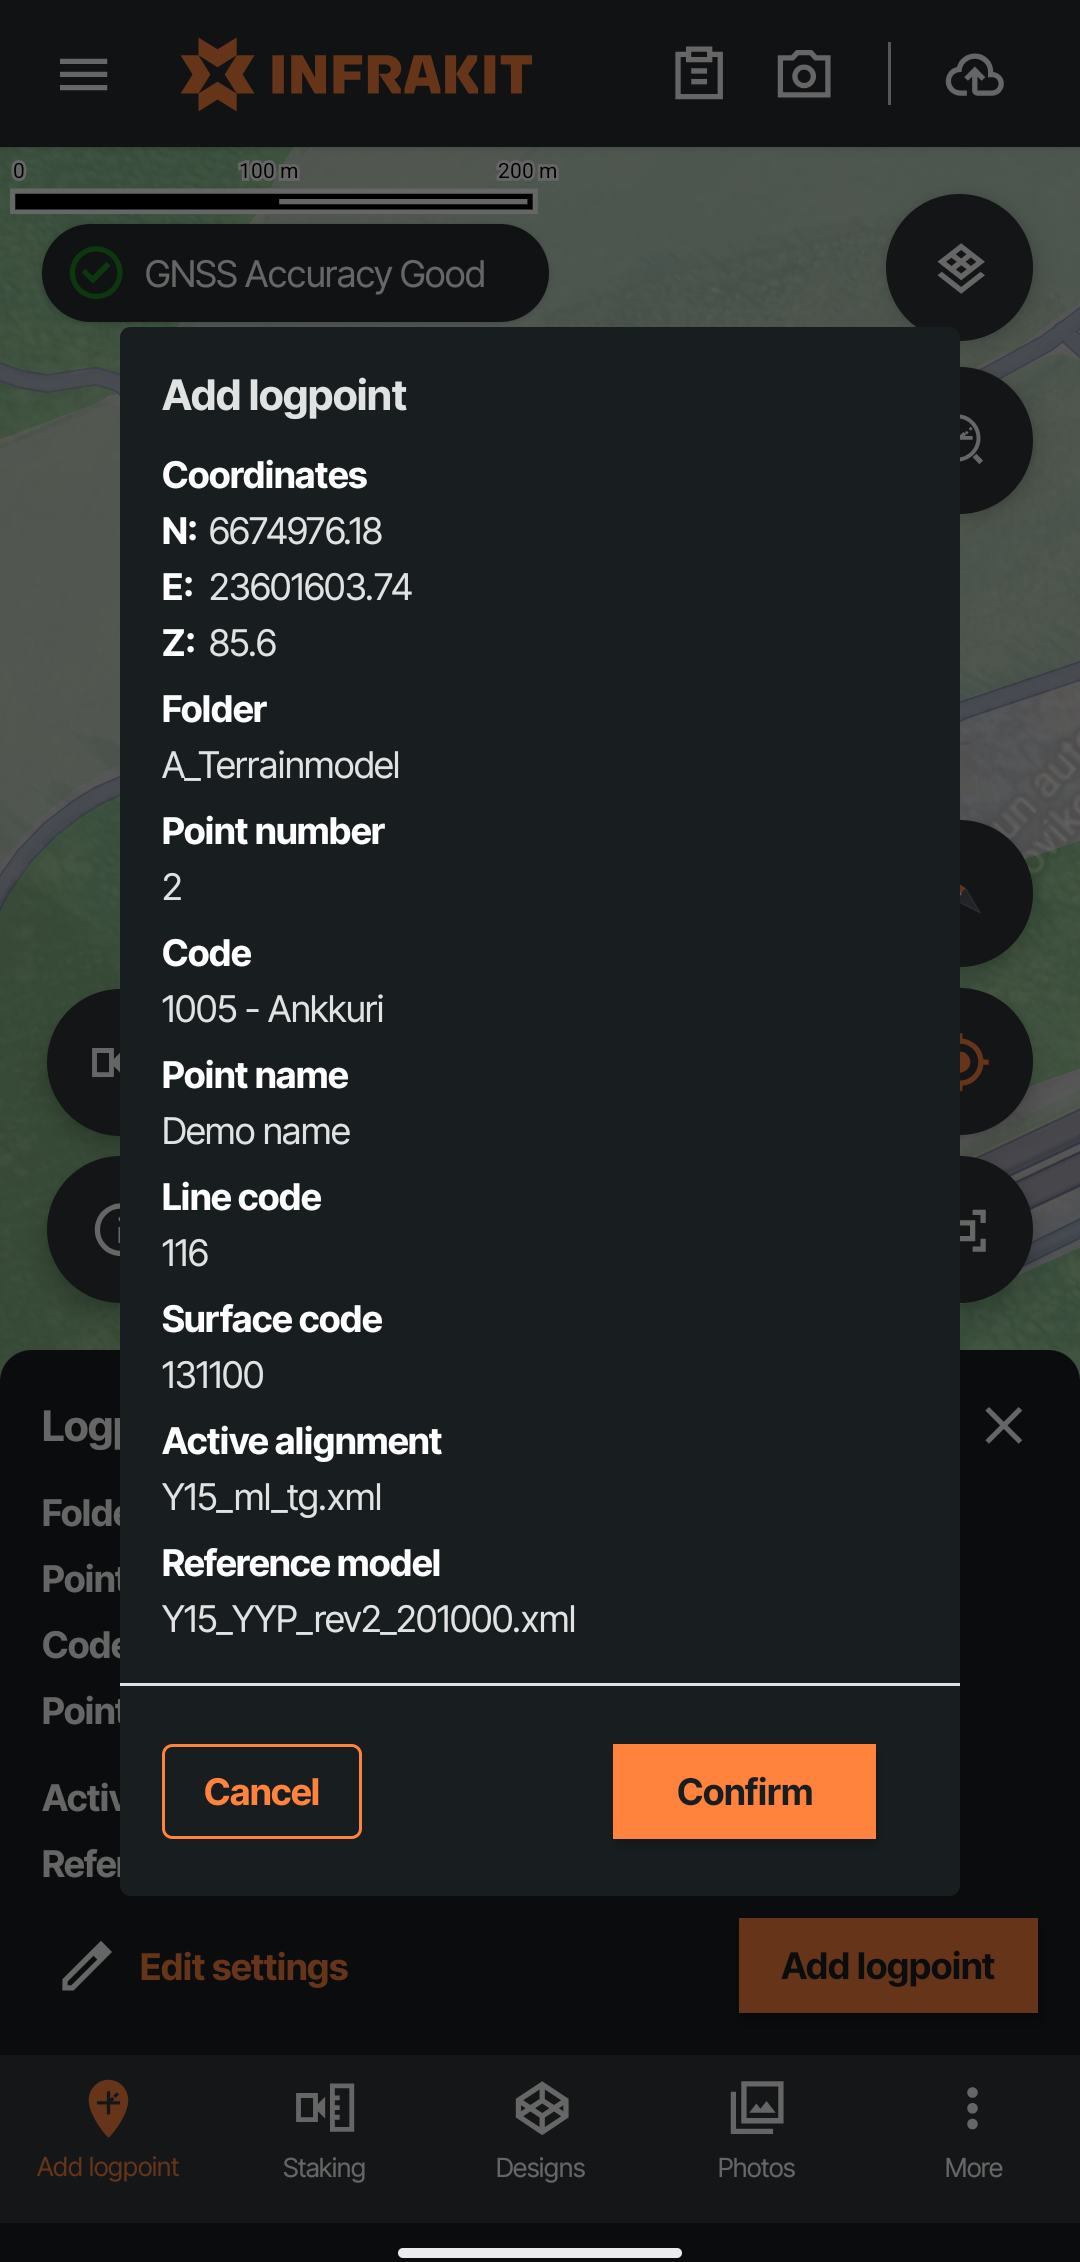
A new window showcasing the info will be shown that has a summary of the choices for the point. The point will be saved after selecting "Confirm"
The confirmation screen can be disabled from the Logpoint settings in the main menu of the application
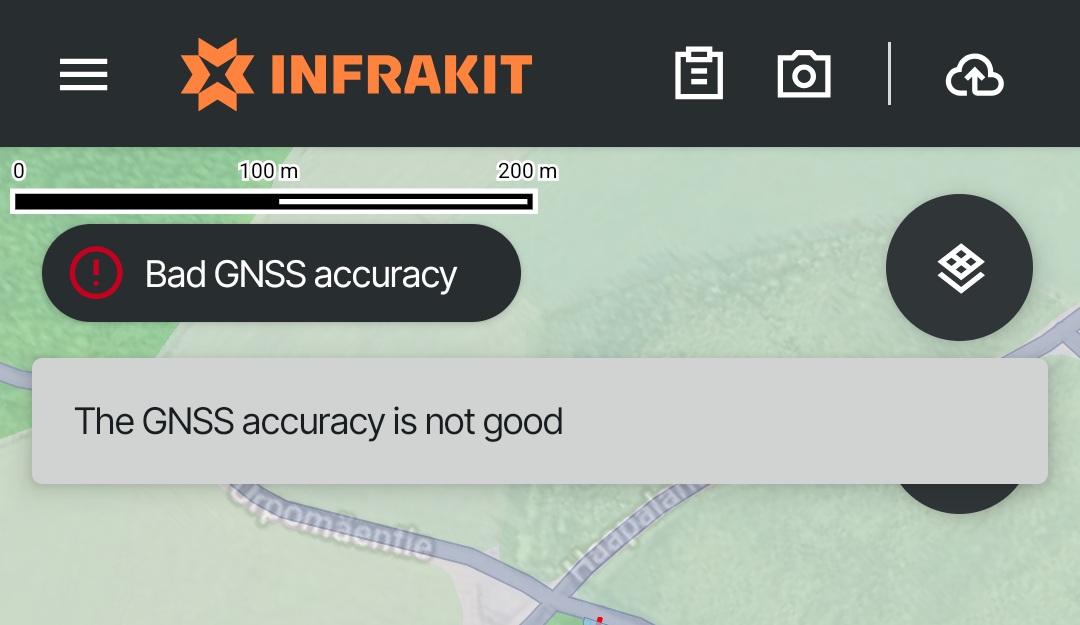
A logpoint will not be saved if the accuracy of the device is not high enough. Accuracy threshold can be configured from the Location & GNSS settings in the main menu
Logpoint settings
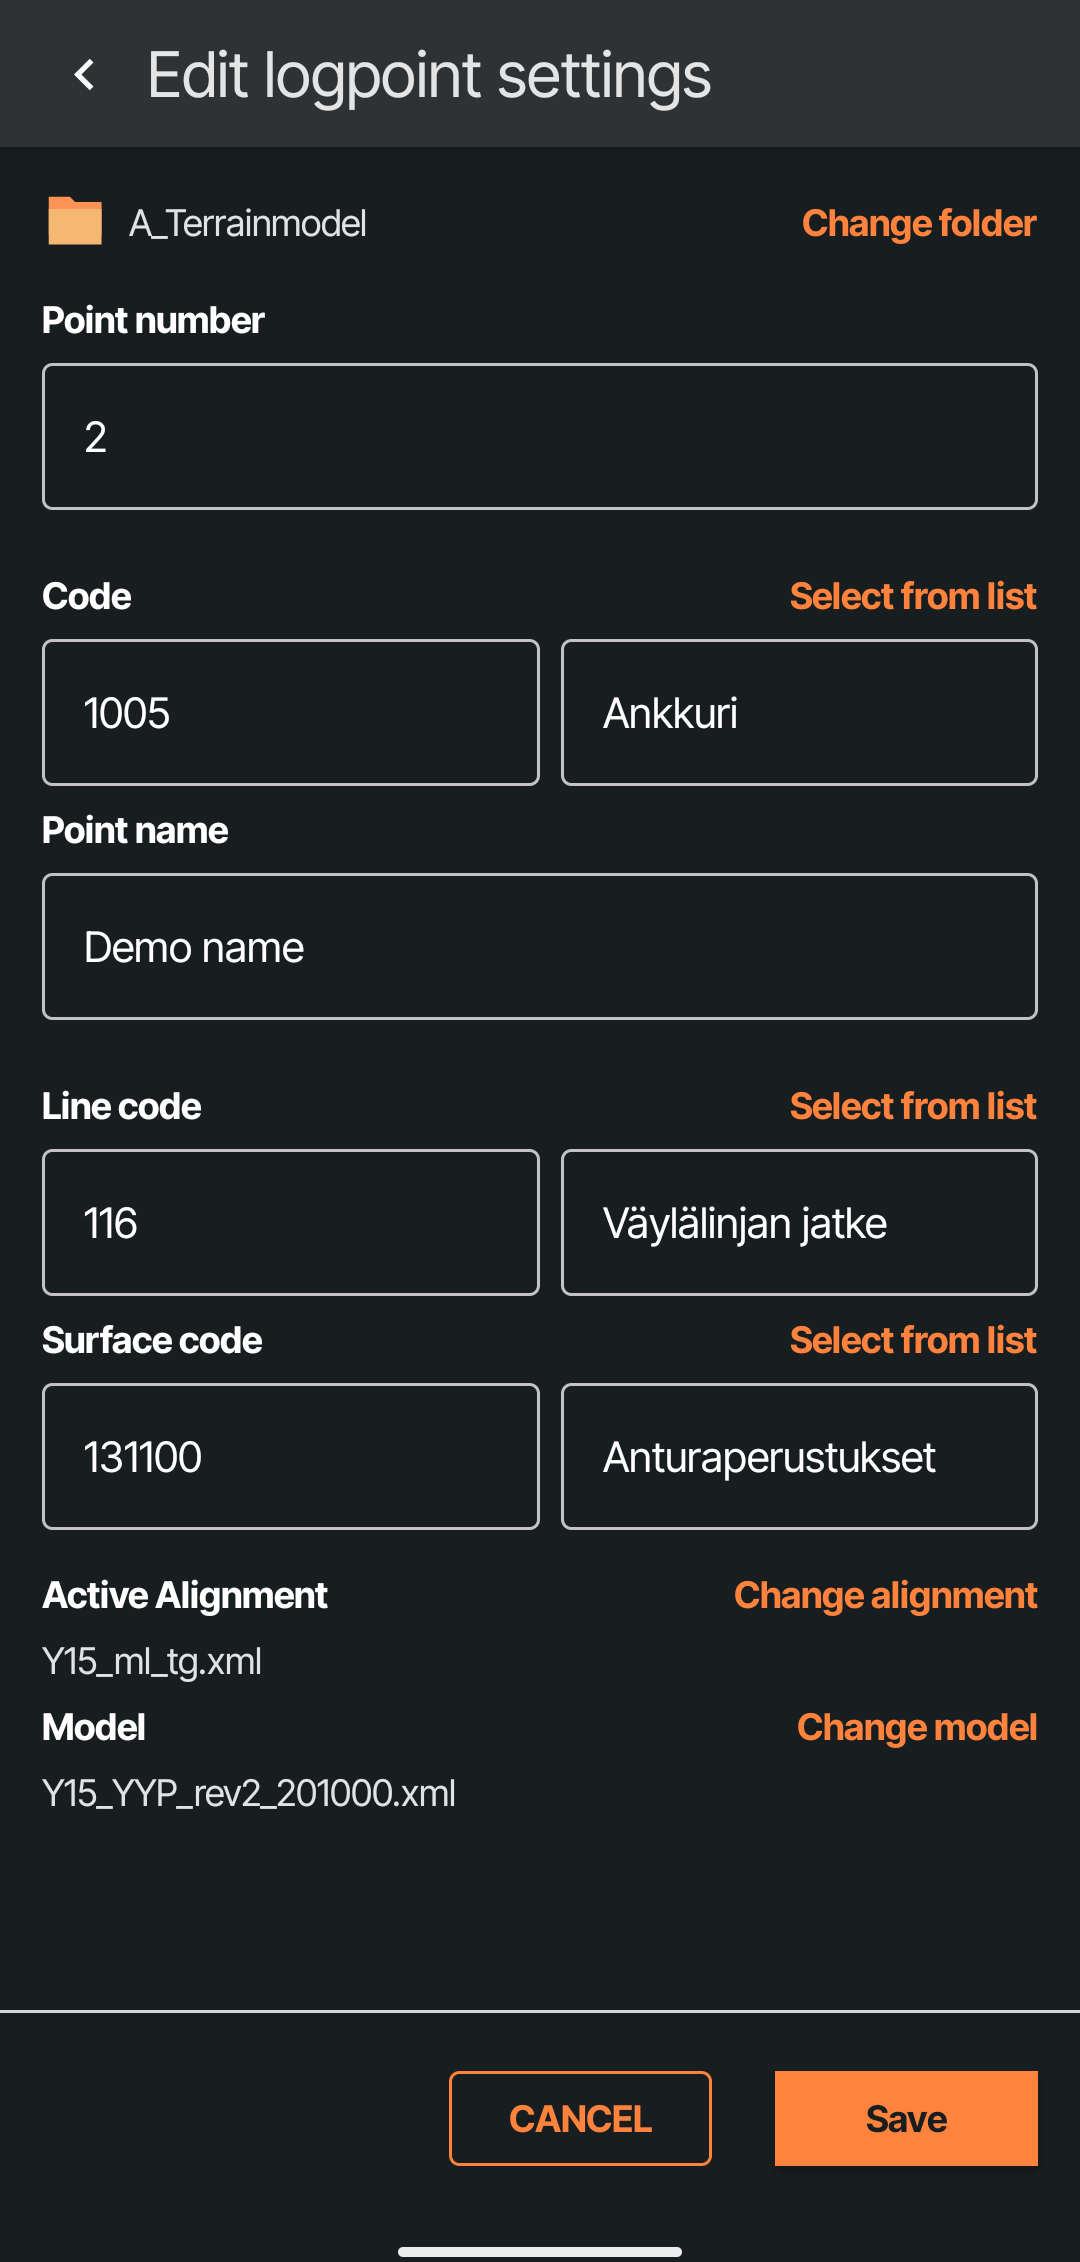
Logpoint settings allow the user to change settings for upcoming surveys. The settings are:
Change folder | Opens the folder tree of the project from which the user can select the folder the logpoint will be saved to |
Point number | You can select the point number (can be also letters) which the first taken point will contain, from here on the number will be incrementally increasing once you take points -> 1->2->3 / a->b->c / 101->102->103 |
Code | Set the code for the logpoint. Left box is the code and right box is the description. Code can be chosen from a list if a codelist is set from the project settings. Code can be also input manually. |
Point name | A name for the point |
Line code | Set the code for the logpoint. Left box is the code and right box is the description. Code can be chosen from a list if a codelist is set from the project settings. Line code can be also input manually. |
Surface code | Set the code for the logpoint. Left box is the code and right box is the description. Code can be chosen from a list if a codelist is set from the project settings. Surface code can be also input manually. |
Active alignment | Select an alignment the from the list of models uploaded to Infrakit project. Note: Changing the active line on the map screen also updates it in this menu. |
Model | Select the model that the points are attached to from the list of models uploaded to Infrakit project. Note: Changing the active model on the map screen also updates it in this menu. |
The settings will remain the same until changed again. Only the active alignment and model can be changed from the map screen
After changing the settings save the changes by selecting "Save"
Staking
Staking is a tool that allows the user to navigate to points or check what the elevation of a model is at a point.
There are multiple ways to start staking.
Tap and hold on top of a model and select "Stake-out"
Activate a point and select "Navigate to point"
Open the "Staking" feature from the application
Options other than the Staking feature are shown in previous chapters of this guide
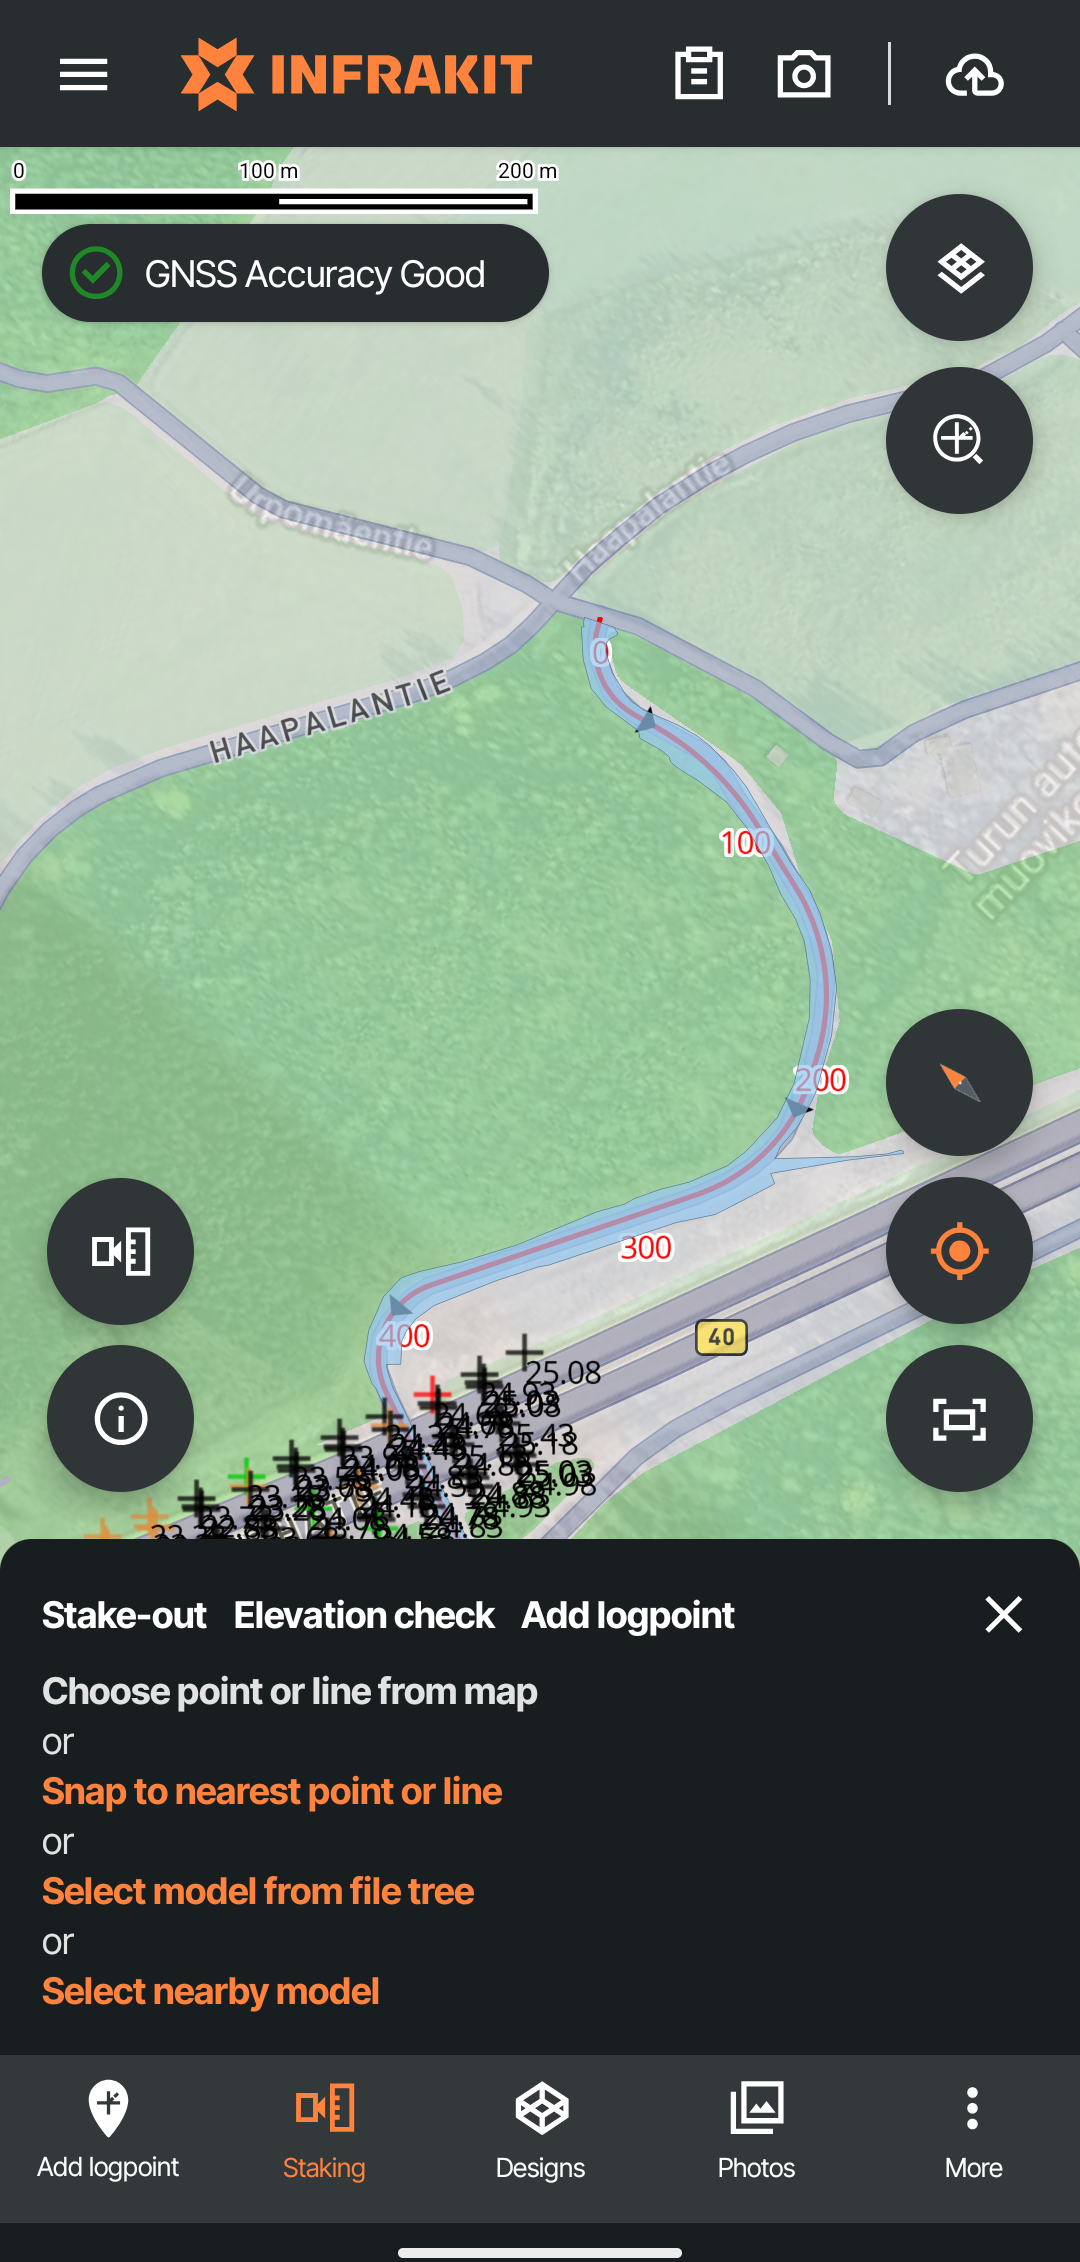
If no model or line is active as the user opens the staking feature, a menu will open promting the user to select a point or line from the map or using one of the options in the menu.
If no models, points or lines are near, the options to automatically them won't return any results
If a model is chosen, a new window will pop up asking the user to also choose an active line
Stake-out
Stake out mode is a bit different depending on whether the user is navigating to a point or a line.
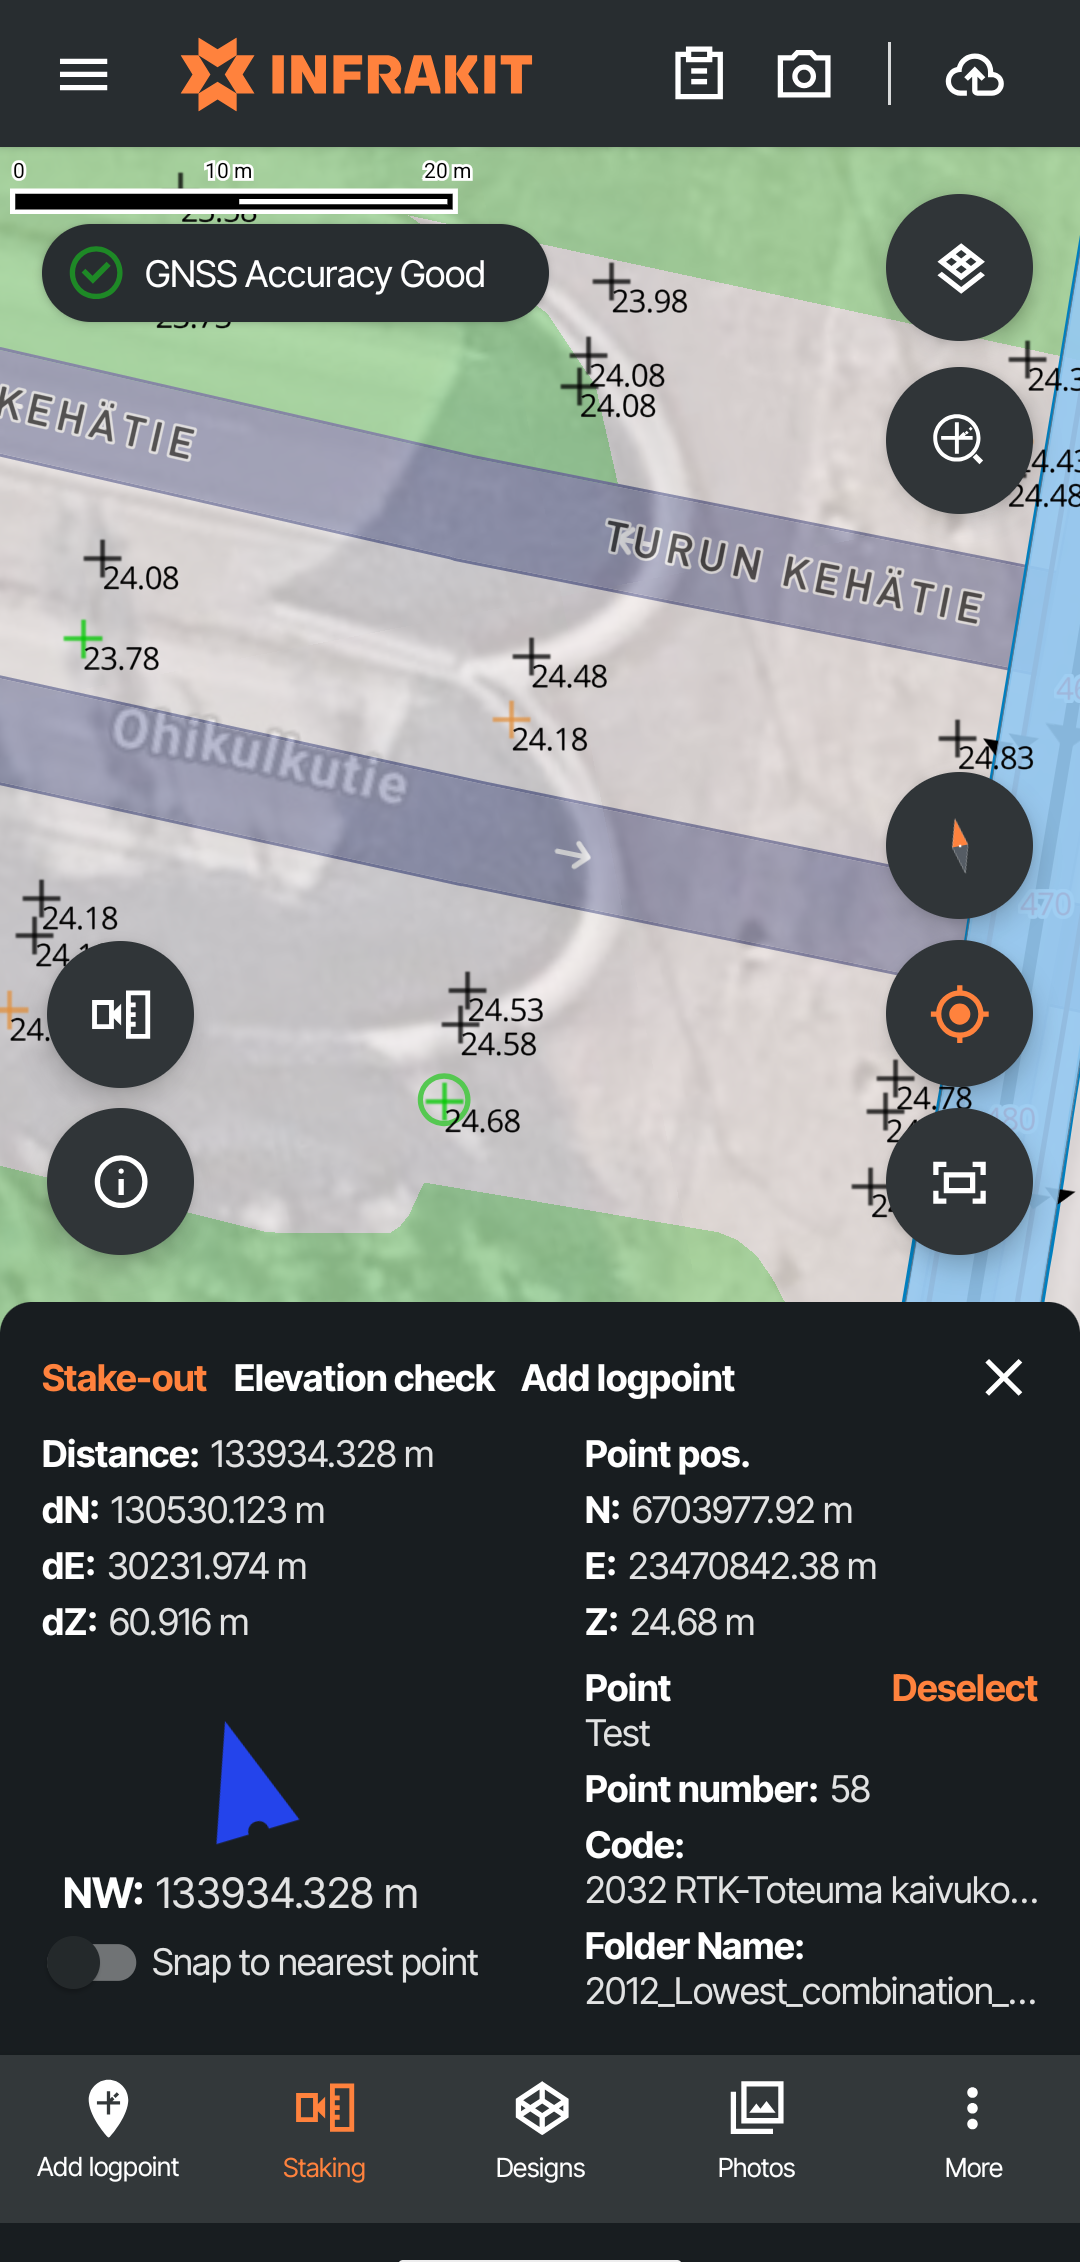
When staking to a point you will see following fields:
Distance | 2D distance between the measured point and the target point |
dN | Deviation in north axis between the measured point and the target point |
dE | Deviation in east axis between the measured point and the target point |
dZ | Deviation in height between the measured point and the target point |
Point pos. | Location of the target point |
Point info | Info of the point |
In the lower left corner the user can see a directional arrow pointing to the target and the distance to the target. The arrow rotates with the device.
By selecting the option "Snap to nearest point" the closest active point will be set as the target.
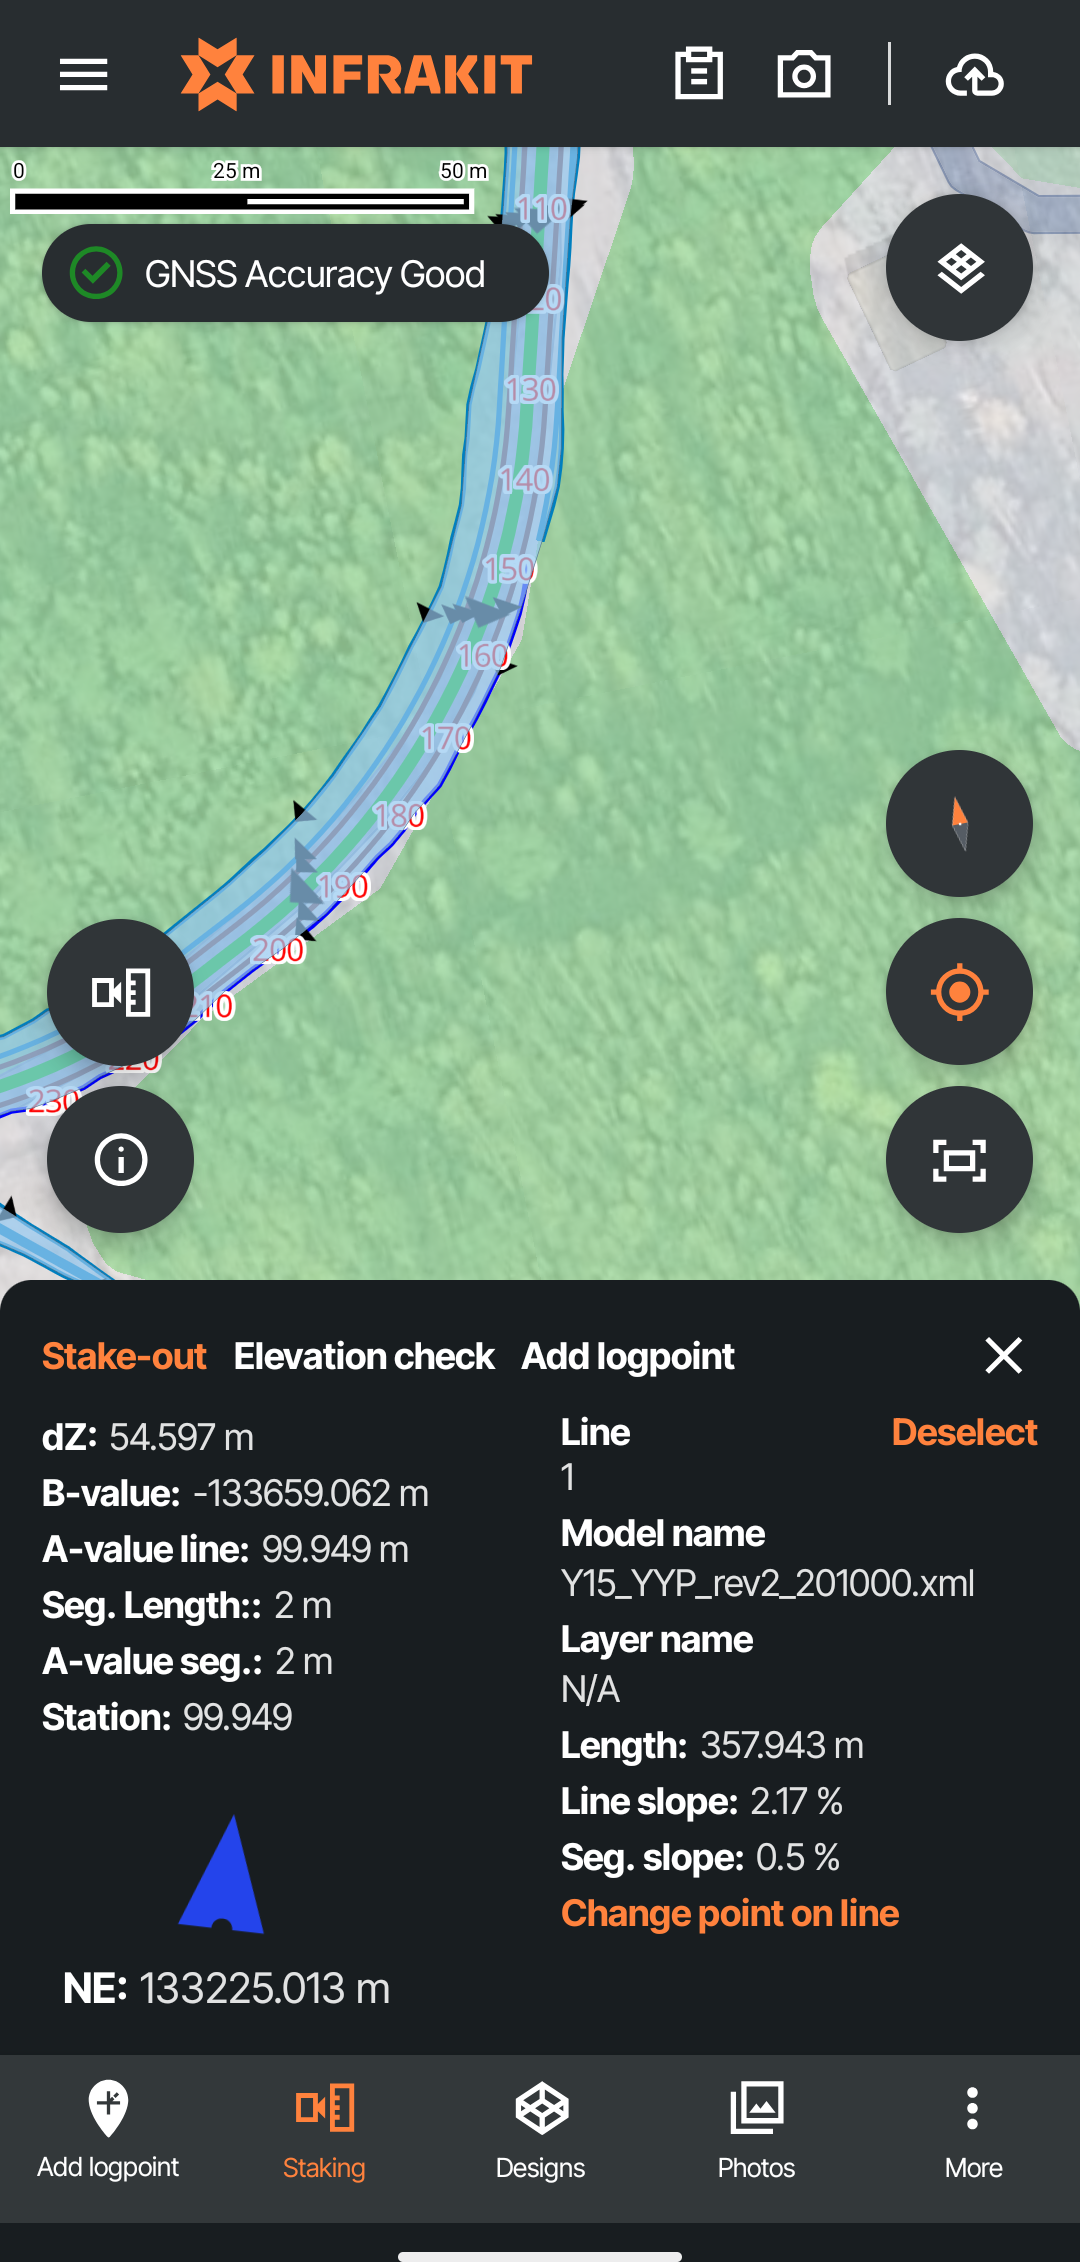
When using the stake-out feature on a line you will see the following fields:
dZ | Difference in elevation compared to the point on the map |
B-value | Perpendicular distance from the selected point on the line |
A-value line | Length of the line |
Seg. Length | Length of the segment that the target point is on |
A-value seg. | Length of the current segment |
Station | Your current station on the active alignment |
Line info | Info about the active line |
In the lower left corner the user can see a directional arrow pointing to the target and the distance to the target. The arrow rotates with the device.
There are multiple possibilities to select a point on the line or actively follow the line.
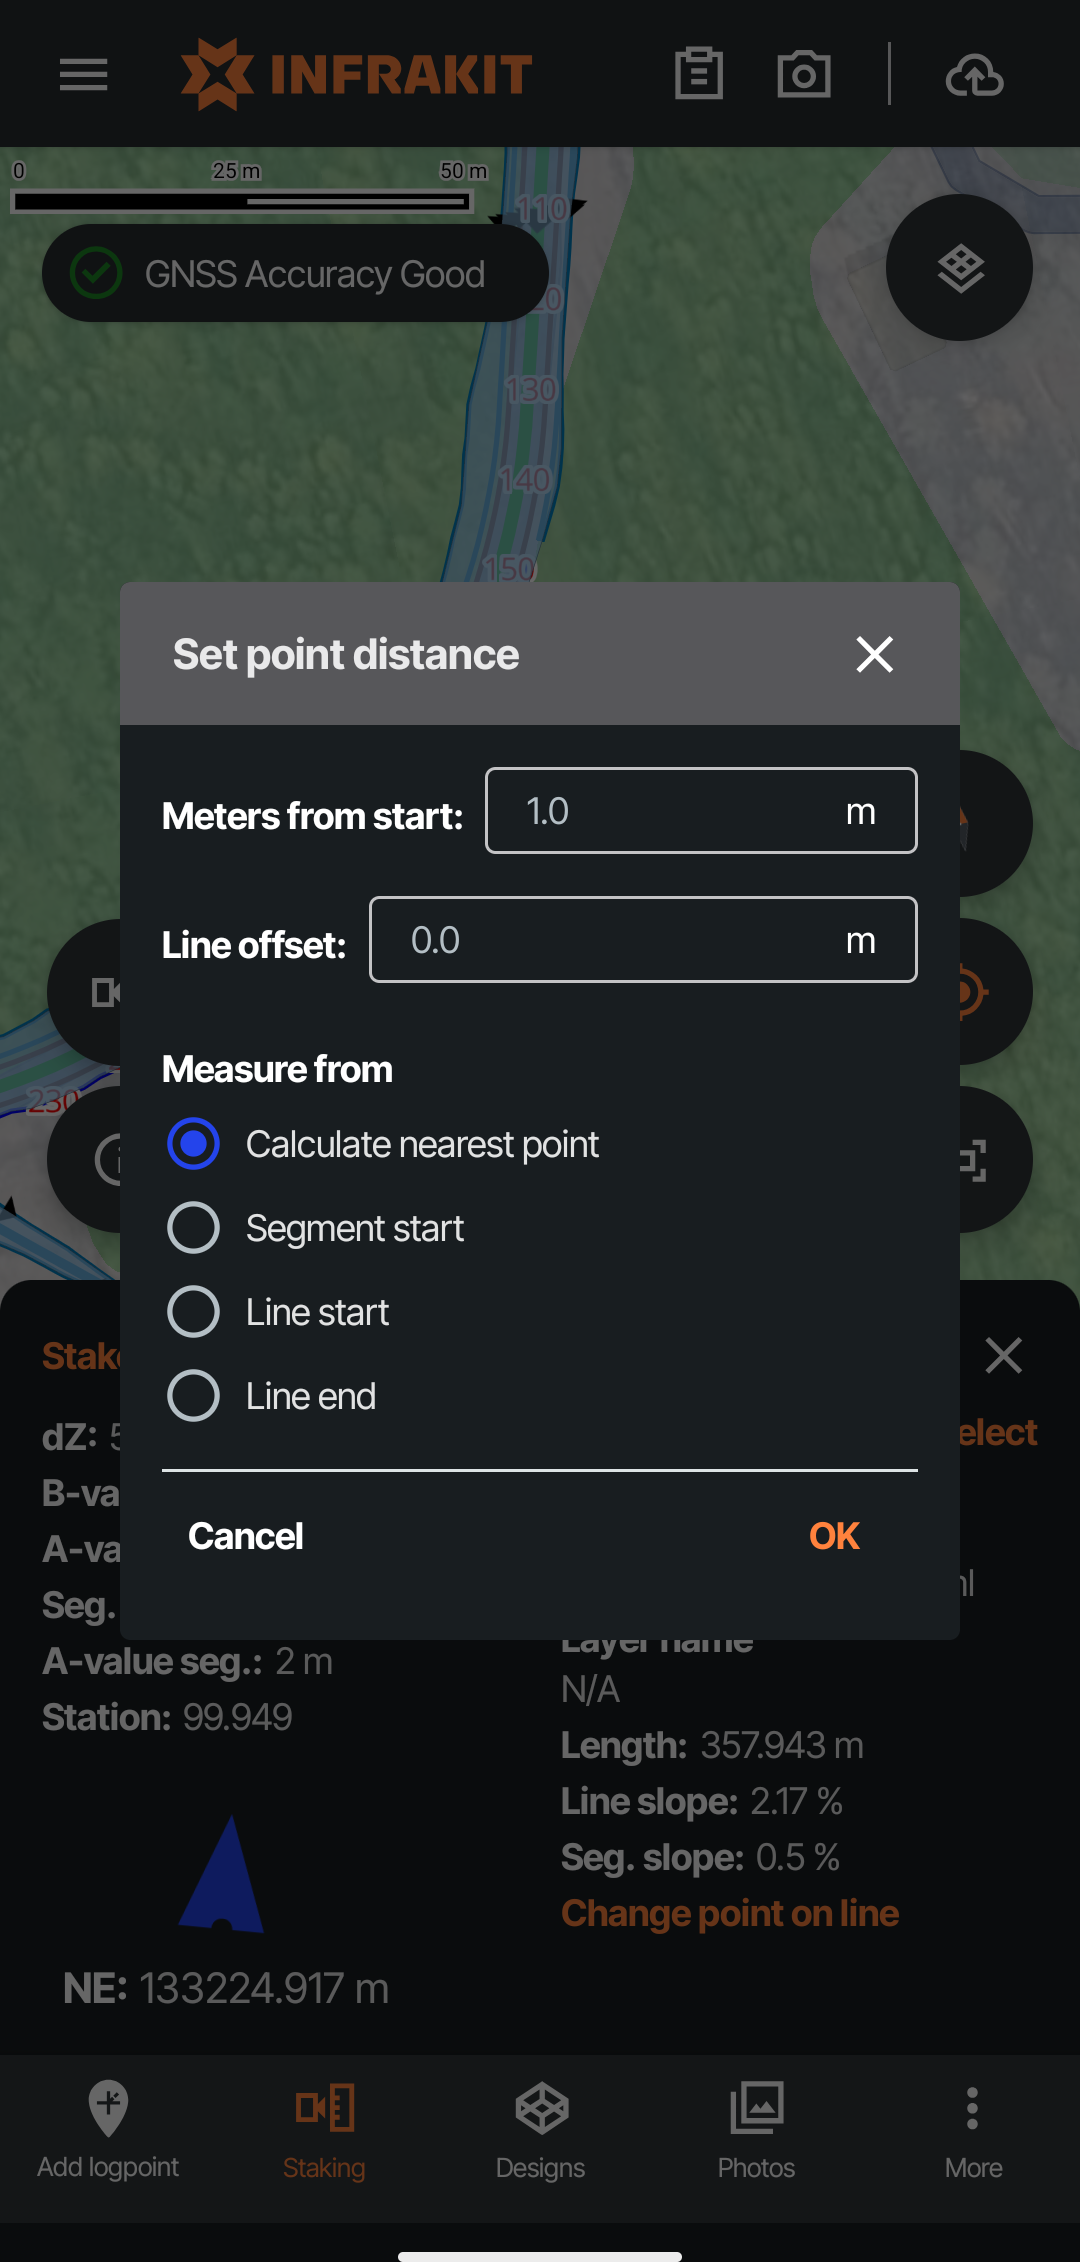
Calculate nearest point | The application will calculate the nearest point on the line and use it as the target. The nearest point is calculated again as the device moves |
Segment start | Select the start of the current segment as the target point |
Line start | Select the start of the line as the target point |
Line end | Select the end of the line as the target point |
There are also two offset values for the line or point:
Meters from start | Move the target point along the selected line the specified amount of meters. Value be positive or negative. |
Line offset | Offsets the whole line the selected distance. |
Check elevation
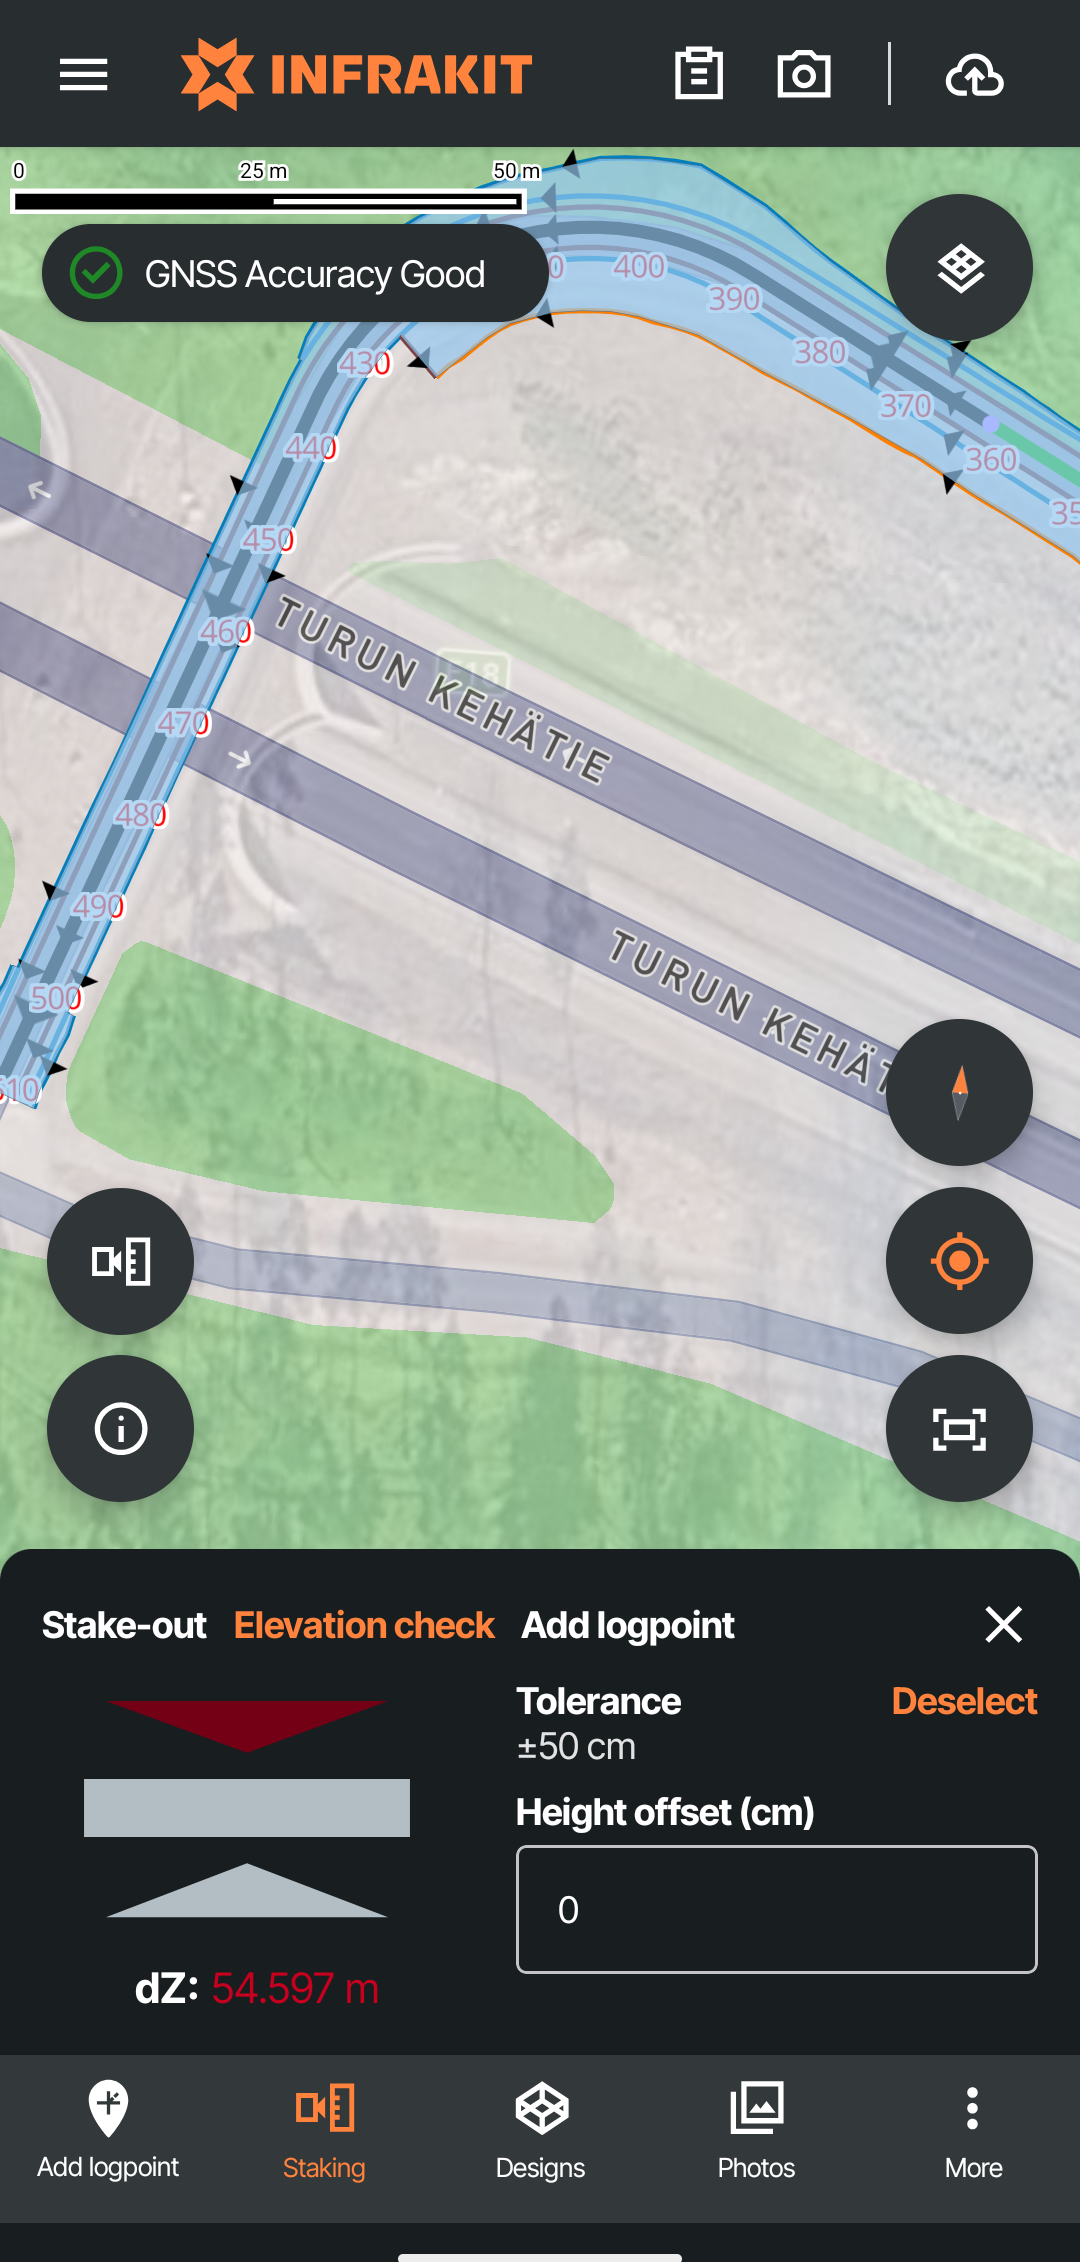
Elevation check compares the height to the selected target. Tolerance for the elevation can be set in Location & GNSS settings in the main menu.
Selecting the Add logpoint option opens the menu showcased in the chapter above
Distance and area calculator
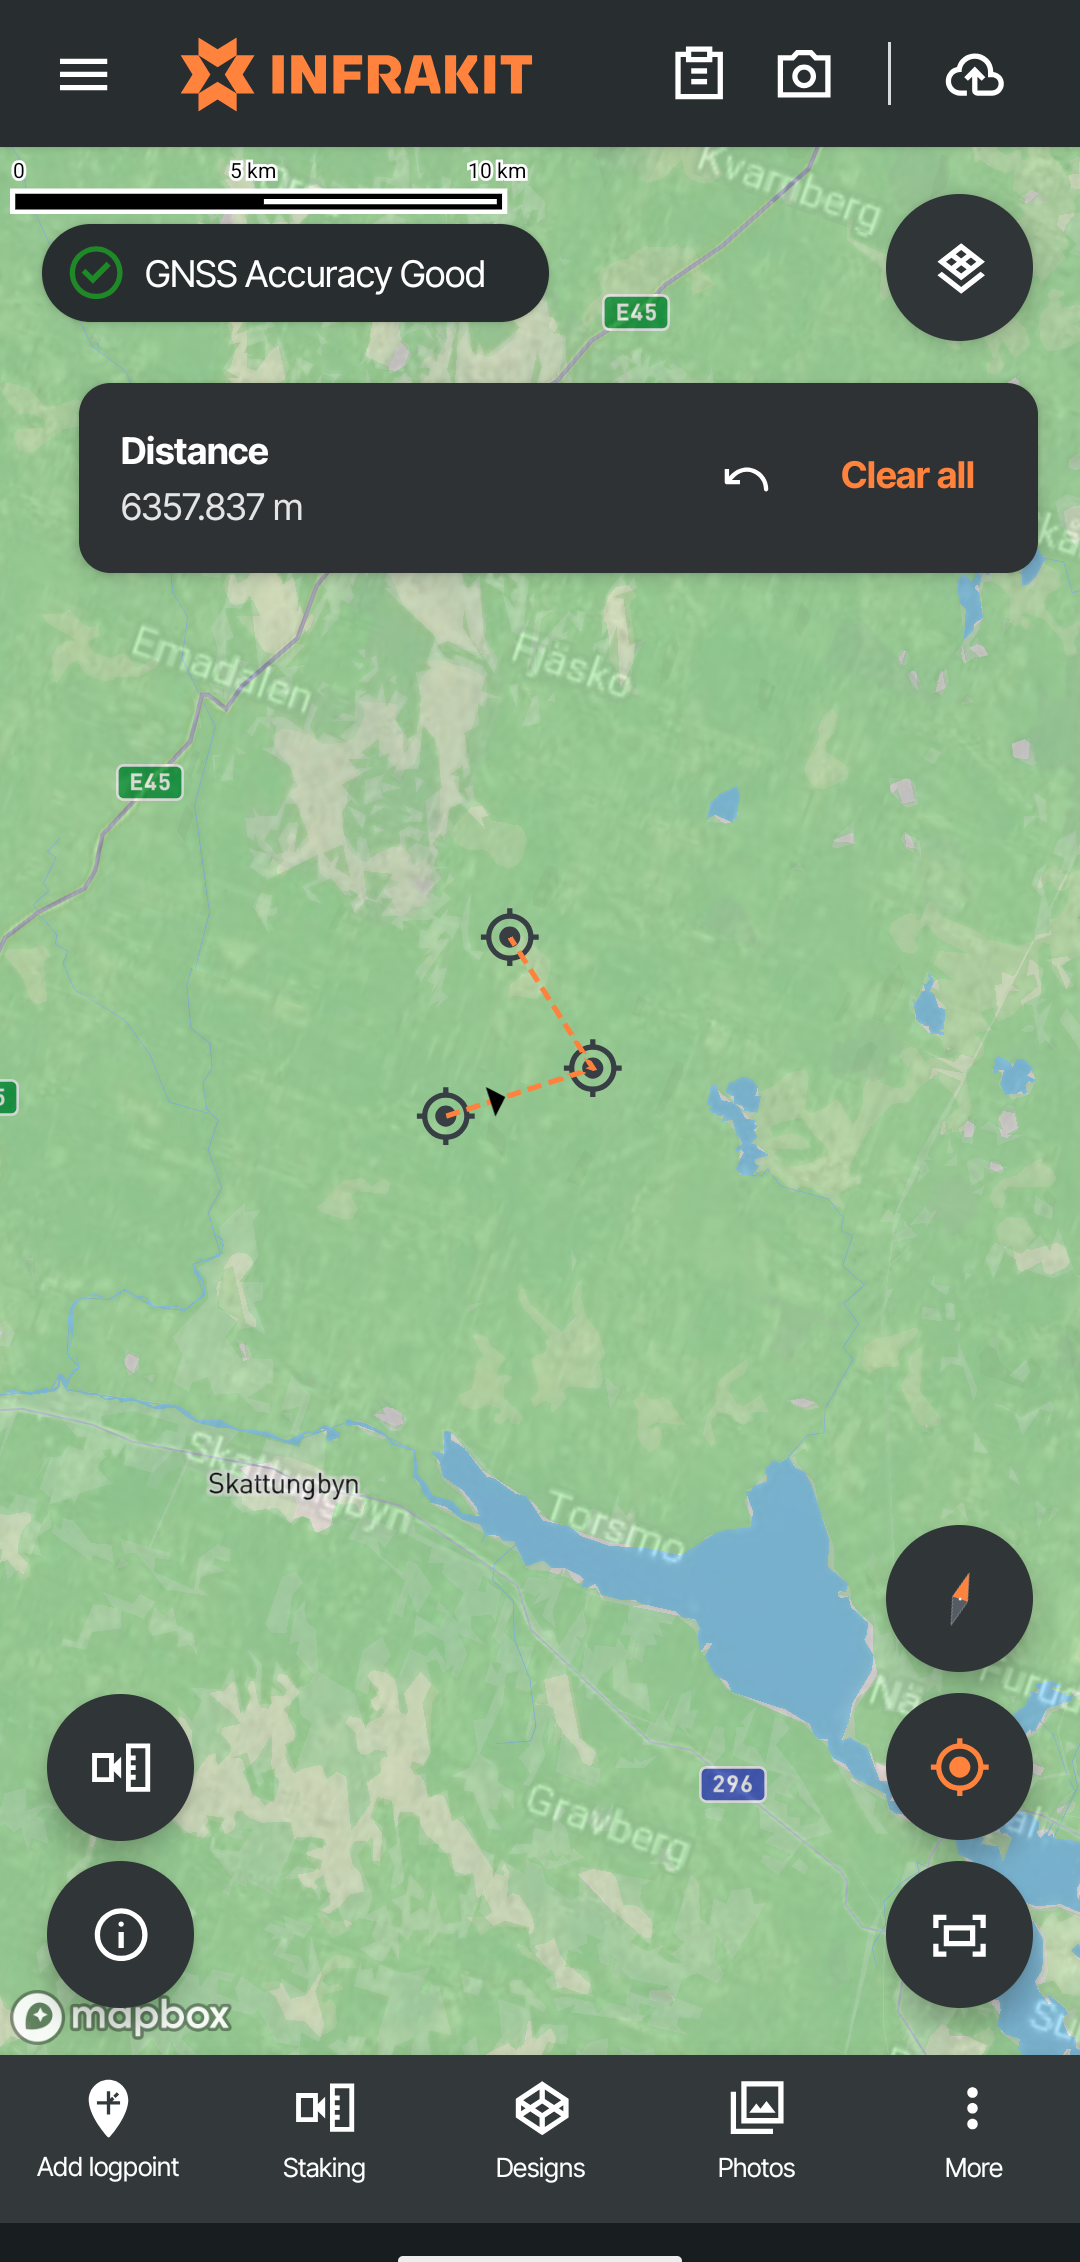
Distance calculator allows the user to measure 2D distance between points.
Tapping on the map begins the measurement and each new tap adds a point to the measurement.
Adding a measurement near a logpoint automatically snaps to the point
Only the total distance is shown and only one measurement can be on the map at a time.
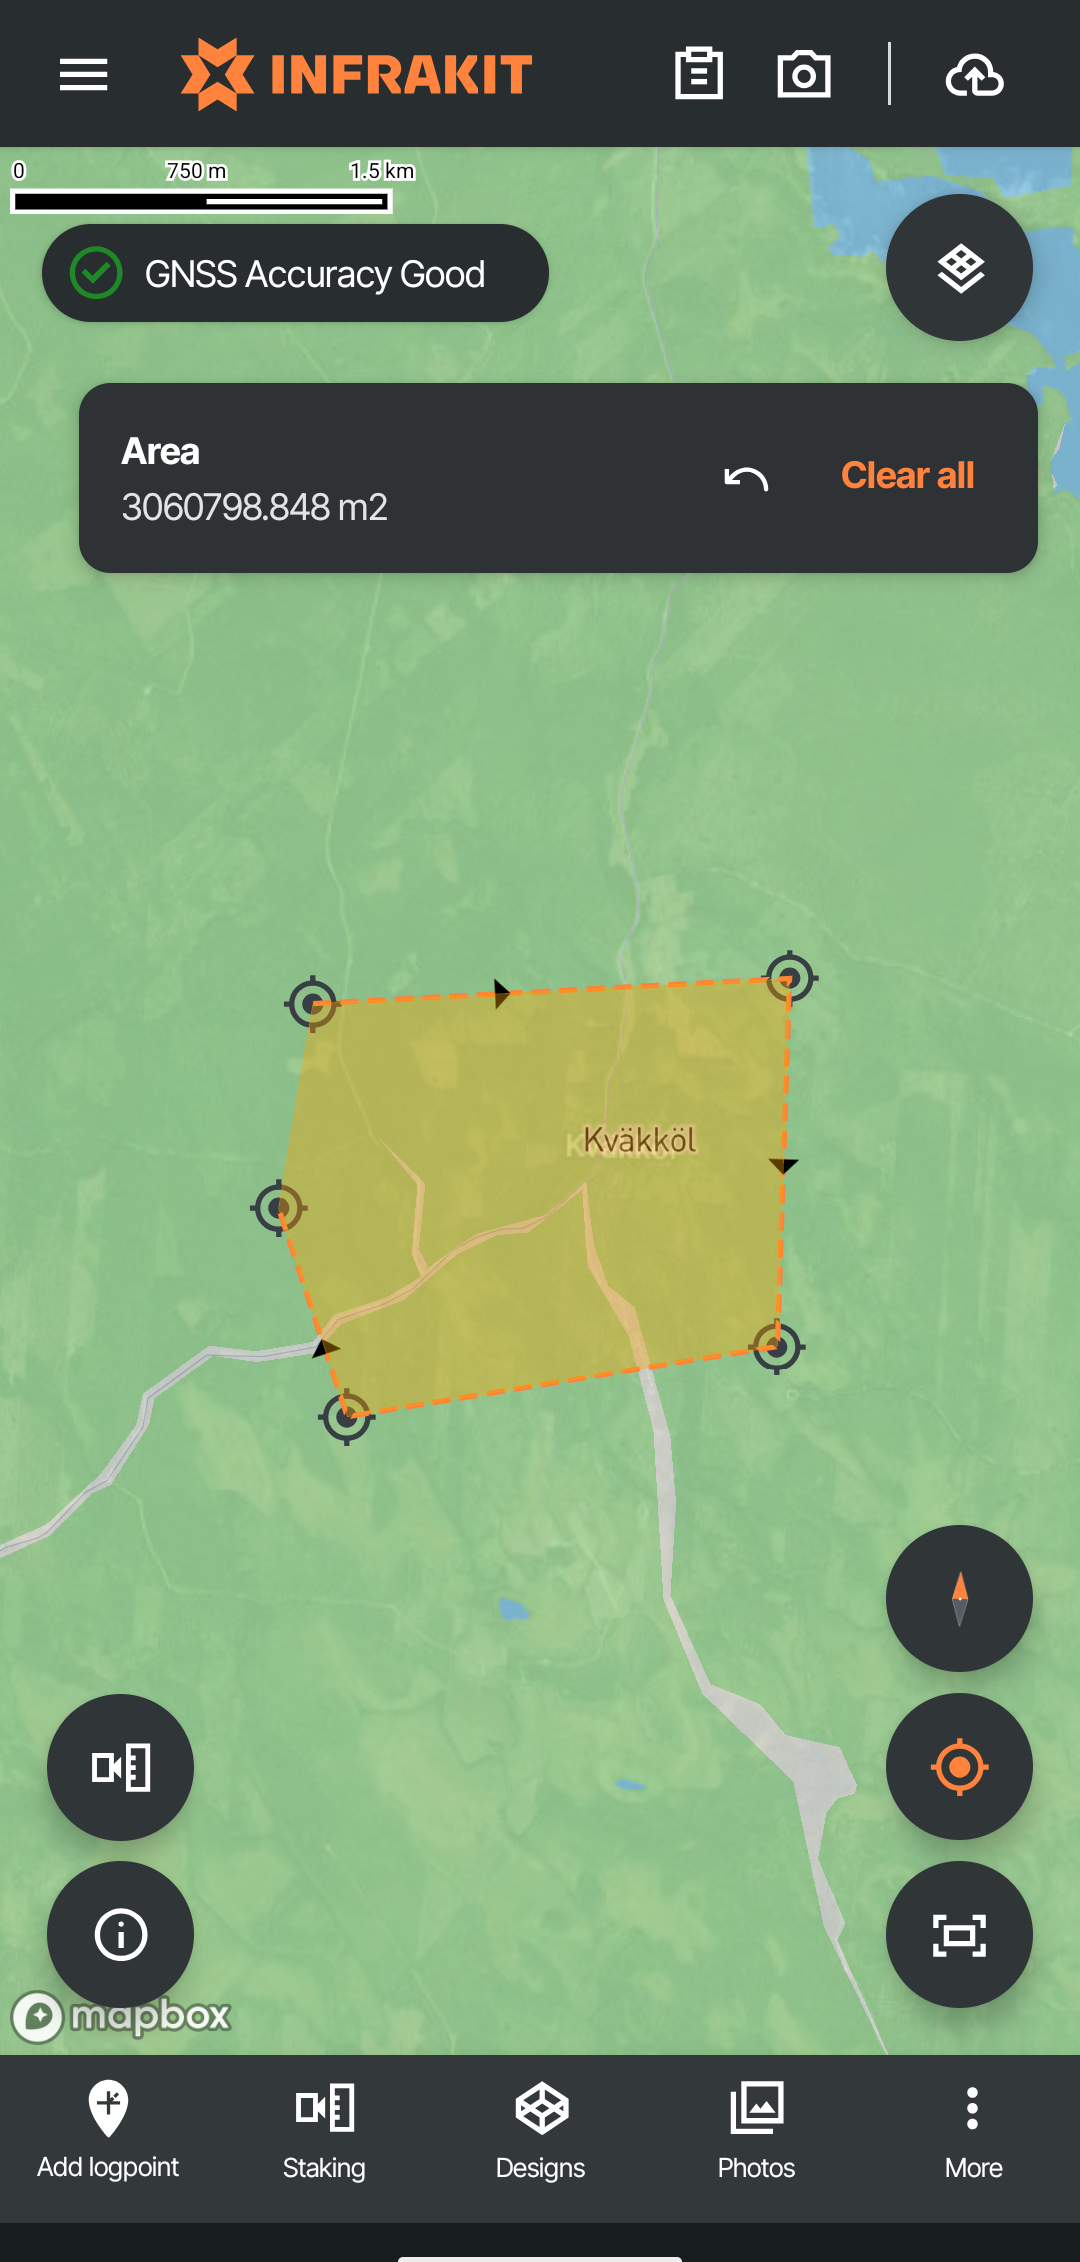
Area measurement works with the same controls as distance. It measures area instead of distance.
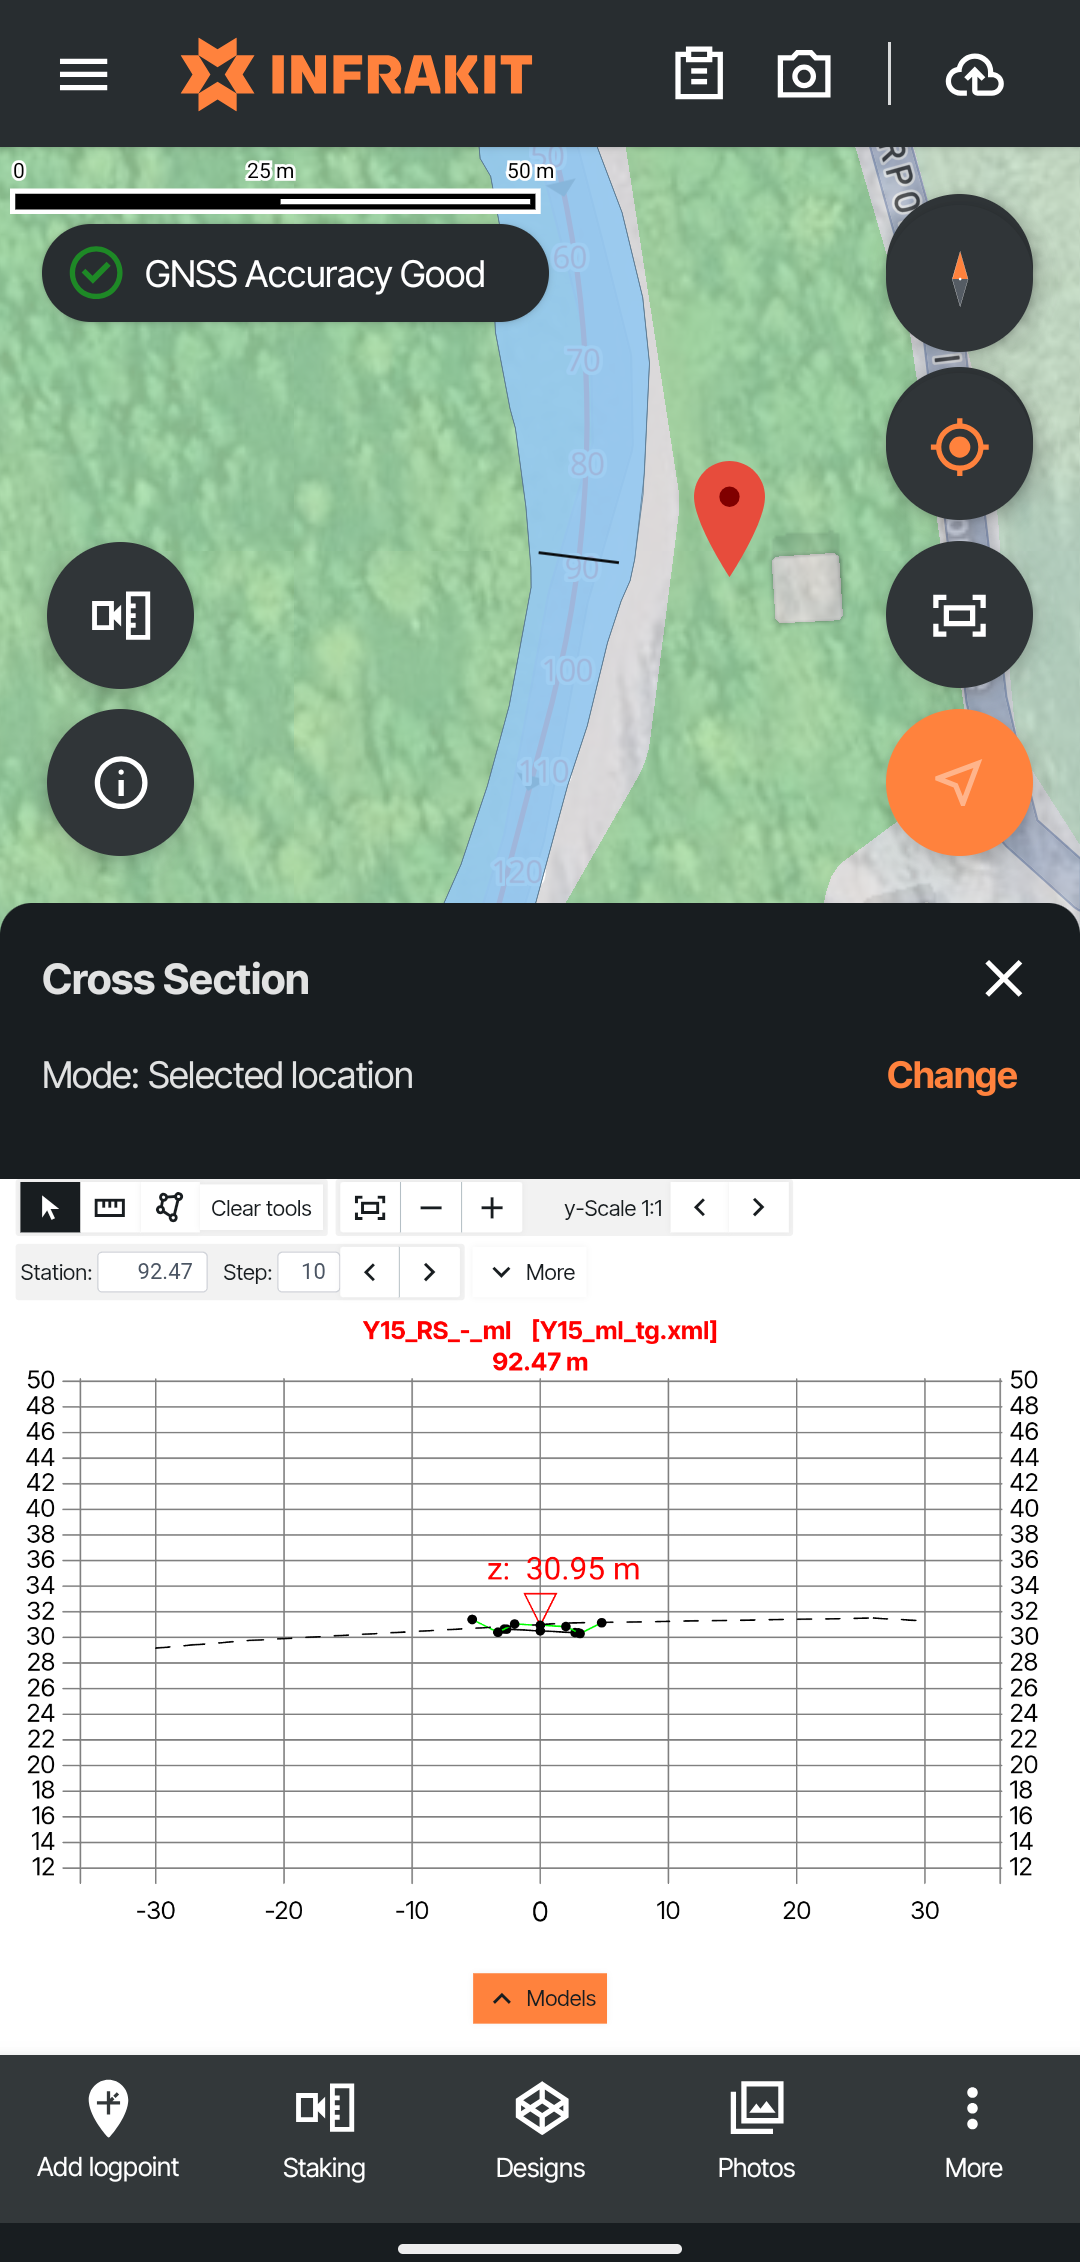
Cross Section
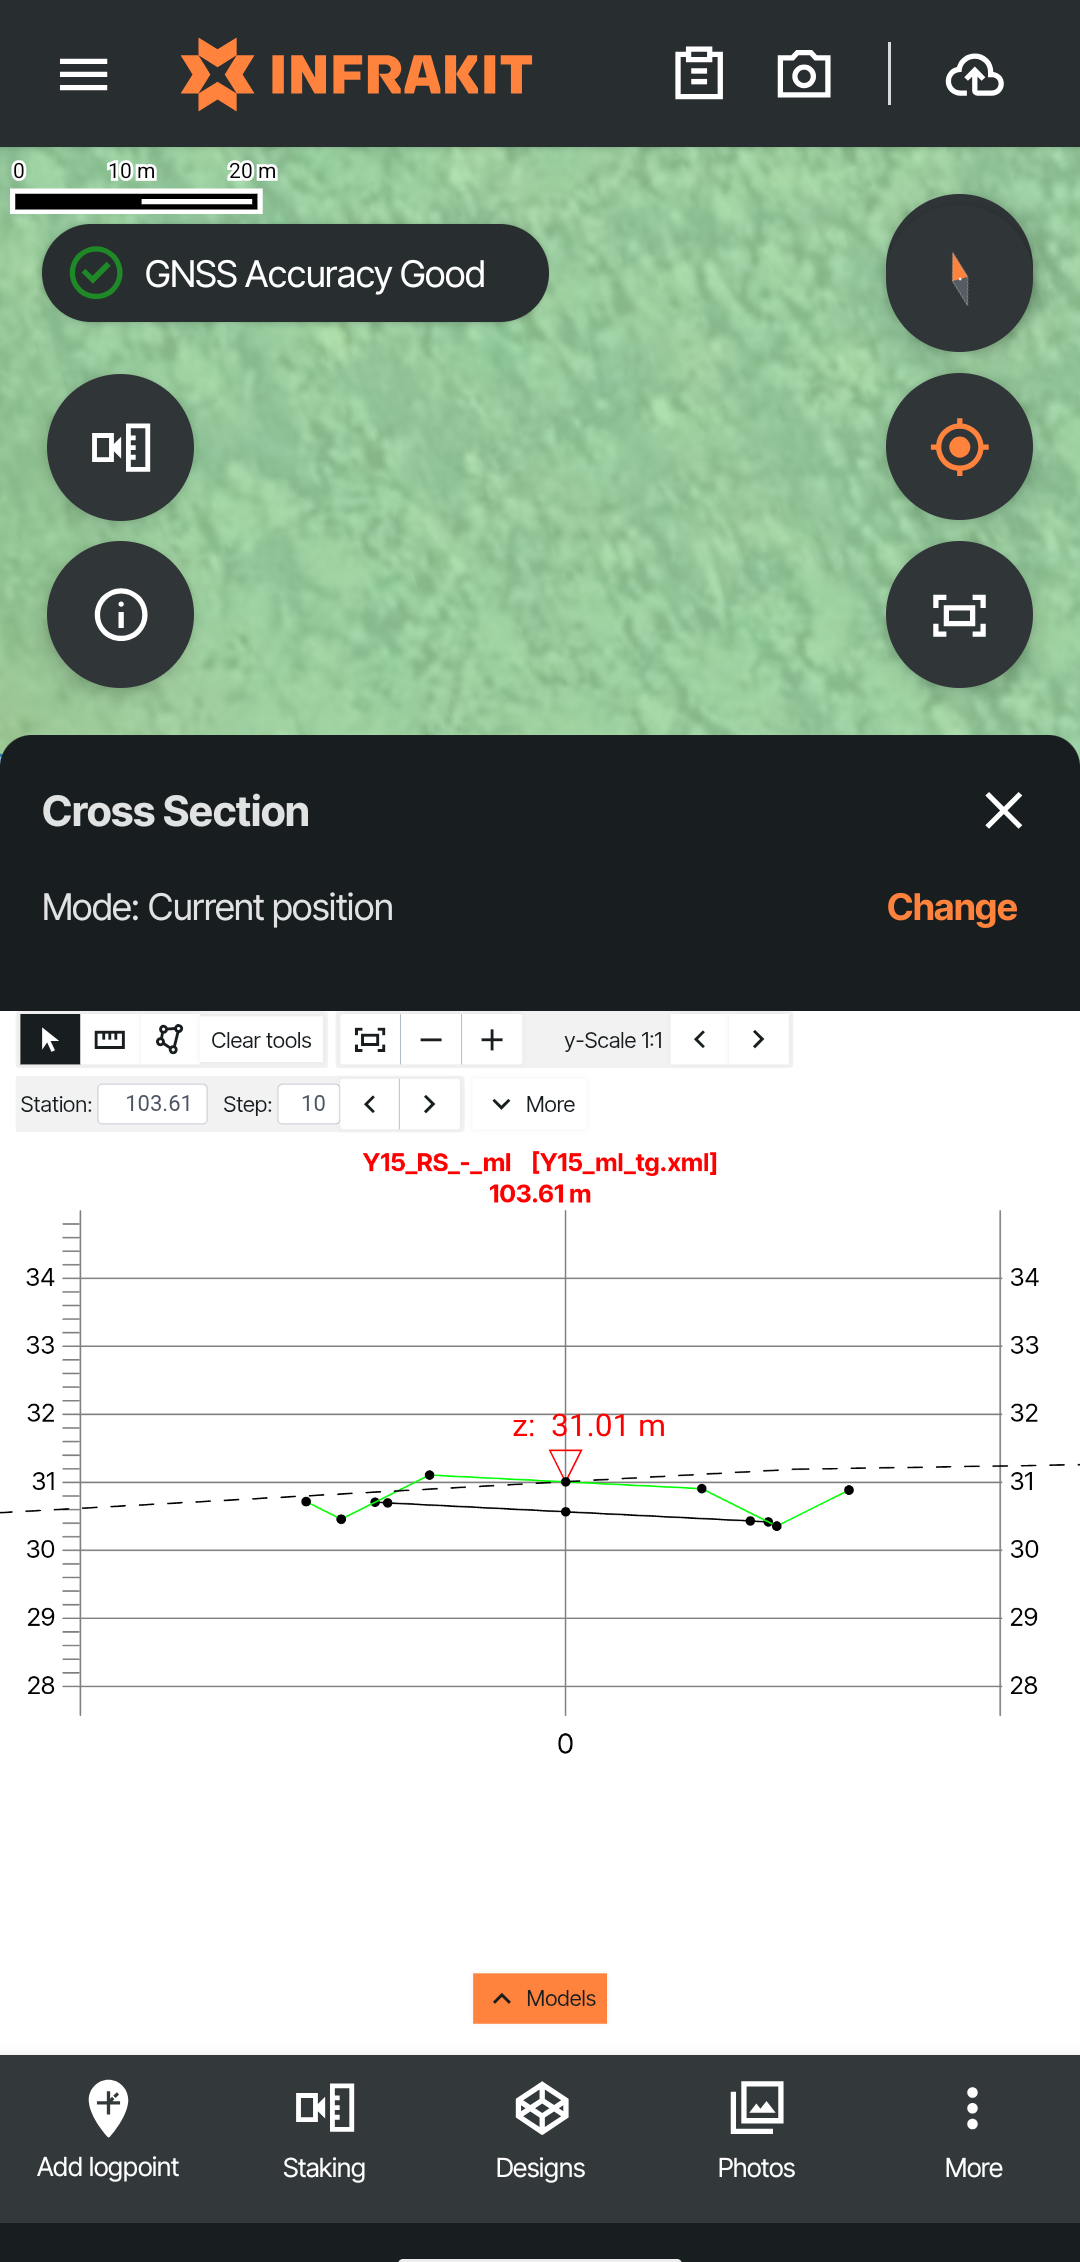
Cross Section tool allows the user to open cross sections from the location they are in or a custom location using the models they have active on the application.
The cross section can be drawn in four ways:
Free draw cross section
Current position
Active tracking
Selected location
Only Free draw cross section is available if no active alignment is chosen
Free draw cross section
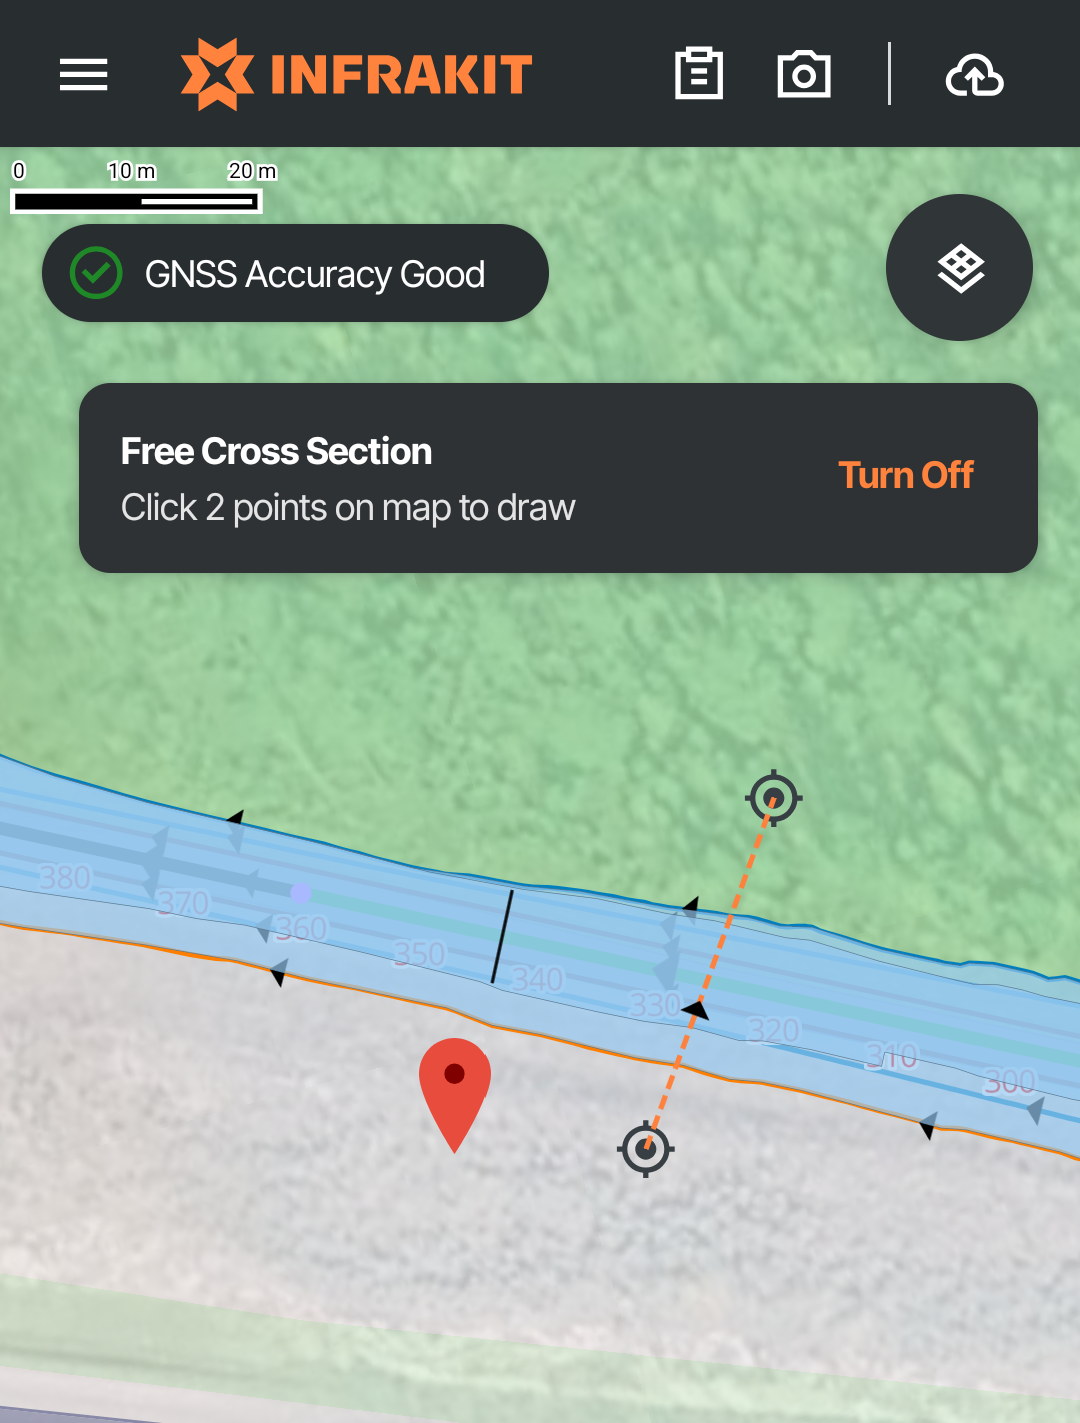
After selecting the option from the menu, a new window prompting the user to draw two points.
The cross section is drawn between these two points.
Current position
By choosing current position the cross section will be drawn from the station of your current position.
Active tracking
Active tracking creates a cross section from the current position of the user but it updates as the user moves in the field.
Selected location
After choosing selected location, the user can tap on the map and a cross section will be drawn to the closest point on the alignment.